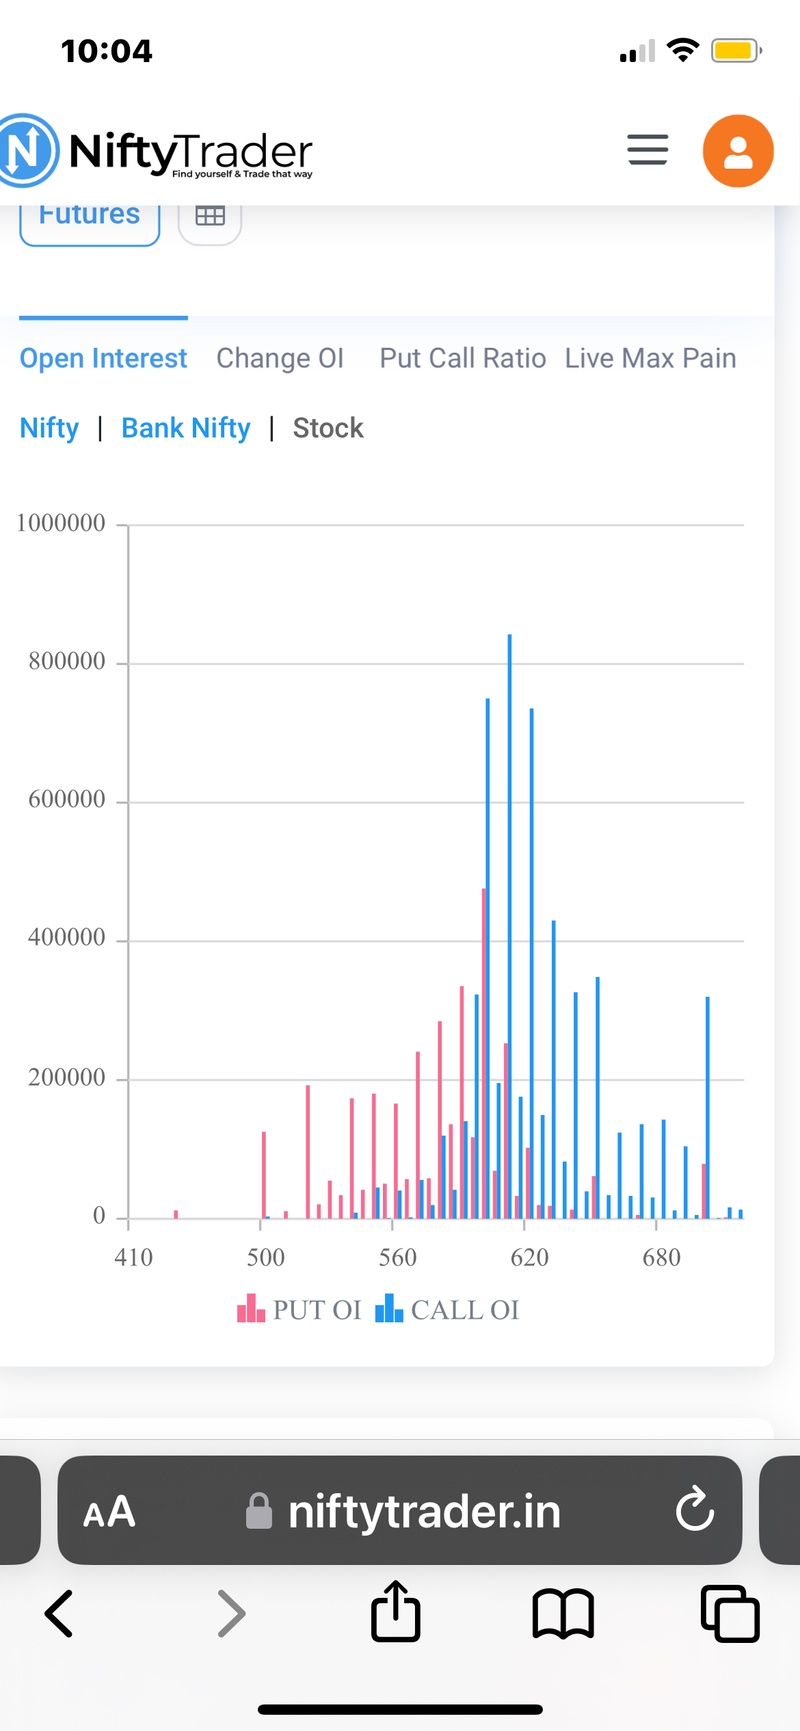
Can u pls explain little more in detail how to understand this chart . Not only information on high OI apart from tht wht more can be analysed basis strike prices and OI