
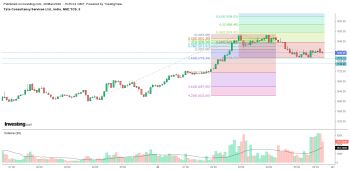
TCS : CMP 1793.4
Take a look 15 mins and 5 mins chart
5 min chart is indicating sub wave 5 is still pending to downside which can drag it to 1763-1748. But after that we can see wave 5 movement as per 15 min chart and 5 wave technical levels should be 1834-1855-1886. Closing basis good support zone is 1685-1680