💡 Decoding the Mutual Fund Factsheet 💡
• Type of fund: Check whether the scheme is an open-ended, close-ended, or interval scheme
• Total AUM: View the total corpus of the scheme managed by the fund. A high AUM indicates the popularity of the scheme and the confidence of investors in the scheme. However, it is neither an indication nor a guarantee of performance
• Fund manager details: Go through the fund manager's qualifications and experience, including how long he/she has been managing the fund. The longer the management period, the better! If the fund manager of a mutual fund changes frequently, it may not bode well for the fund's performance. A frequently changing fund strategy may lead to a lot of underperformance in the scheme’s returns
• Benchmark: A benchmark is a parameter for comparing the performance of the fund. For instance, indices like Nifty, BSE 200, and BSE 500 are often used as benchmarks to assess a fund's performance. Check if the fund beats the benchmark consistently. That is usually a sign of a fund worth investing
• Miscellaneous information: This section offers details relating to exit load, SIP, minimum investment, plan types, and so on. You should find a range of information to support your investment decision
PORTFOLIO DETAILS
Get a detailed bifurcation of the fund’s portfolio based on the securities and the industries that the fund invests. You can check the weightage and concentration of the portfolio in various sectors and securities. This section gives you an idea about the fund’s composition in different industries and assets.
QUANTITATIVE DATA
Explore information about the critical indicators for assessing the mutual fund's performance. Some vital indicators for equity mutual funds are mentioned below:
• Standard deviation: This signifies the absolute risk of a mutual fund, including systematic and unsystematic risk. As an investor, you should look for a scheme with a lower standard deviation
• Beta: This measures the fund's volatility to the index, which is also known as market risk. A high beta value signifies a higher risk. A higher beta scheme typically carries more risk, and investors could face losses if the market falls. However, funds with a higher beta could also prove beneficial in a rising market as they tend to show higher growth compared to the index
• Sharpe ratio: This represents the excess return over the risk-free return offered by the fund per unit of total risk. The higher the Sharpe ratio, the better the fund
• Portfolio turnover ratio: This shows how frequently the portfolio is churned. To calculate, simply divide the minimum of securities purchased or sold by the total AUM in a year. Here’s the formula:
Portfolio Turnover Ratio = Minimum of Securities Purchased or Sold/Total AUM
Suppose the portfolio turnover ratio is 50%. That means one-half of the securities have been churned in the last year. Keep in mind that a higher turnover pushes up the fund's expense ratio. That's why a lower rate is usually preferable
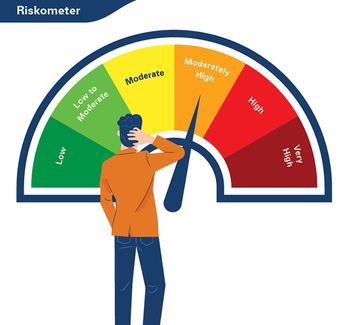
RISKOMETER
SEBI has categorized mutual funds into six categories based on the risk involved. These are:
• Low risk
• Moderately low risk
• Moderate risk
• Moderately high risk
• High risk
• Very high risk
Keep the risk classifications in mind when choosing a mutual fund based on your financial goals.