Today we are discussing every dividend loving investor's favourite the ITC. Company delivered decent Q4 results and beaten the analysts estimates. Both revenue and profitability improved exceptionally well. Revenue grew by around 15% YOY basis and Net Profit rose by 12% in the same time frame. The company announced attractive dividend of Rs. 6.25 as usual.
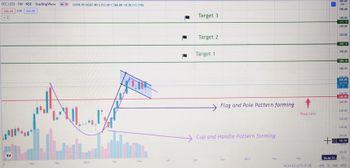
Now let's analyse the stock's performance from the technical perspective perspective in a weekly time frame and see if any swing or positional opportunity exists. In chart, we can see a slight consolidation in recent weeks. Where markets are volatile and even underperforming in these turbulent times, ITC is withstanding this storm and outperforming both indices and broader markets. ITC gave more than 20% returns in past couple of months. In the chart we can witness two classical patterns being created. And the confluence of both these patterns is a high probability setup. If any weekly closing above the current consolidation range or breakout occurs with significant volume activity. In coming weeks ITC can continue to show its bullish strength combined with never before seen momentum. And this can push this stock to much higher levels. The likely targets are mentioned in the chart. However if the breakout of these patterns fails or the market conditions pressure prevails and overwhelms this stock as well. Then a strict stoploss as stated in the chart need to be taken care of.
This chart analysis is just for educational purposes only. We are neither Sebi registered nor provide calls. Please consult with your financial advisor before any trade or investment.
Let's see if this time this so called meme stock can stand the test of time and continue to outperform.