BAJAJ FINANCE
• Company shows a strong AUM growth of 29% YoY. NII growing of 30% YoY and 12.5% QoQ to INR 6,064 Cr and PAT growth of 80% YoY to INR 2,420 Cr.
• Opex to NII stood at 32.5% as against 26.6% in Q4FY21
• Capital adequacy remained strong at 27.22% as of March 31, 2022. Tier-1 capital was 24.75%, it was 25.11% in FY21, and 21.27% in FY20
• In Q4FY22, the Company added 81 new locations to its distribution footprint. Total geographic footprint stood at 3,504 locations and 1,33,200+ distribution points. In FY22, the Company added 516 new locations. The Company continues to invest deeply in UP, Bihar, and the northeastern states
• Last three-year GNPA FY22,21,20 stood at 1.60 ,1.79%, 1.61% respectively
• Last three-year NPA FY22,21,20 stood at 0.68% ,0.75%, and 0.65% respectively
• In Q4FY22, the cost of funds was 6.71%. The liquidity buffer stood at INR 10110 Cr as of March 31, 2022
DIGITAL PLATFORM
• Company is shifting toward a digital app platform to increase its reach geographically and to compete with other lending business
• Phase 1 of the web platform will go live by October 2022 and phase 2 by March 2023
• Insurance marketplace went live in March 2022 offering 4 motor insurance products, 9 health insurance products, 8 asset insurance products, and 345 pocket insurance products
• In Q4FY22, the Company added net 2.6 Mn users on its digital app platform against 3.6 MM in Q3FY22. The total user added in the year is 9 Mn, which is the highest addition in a year. In FY23, the Company intends to add 14-16 Mn net new users
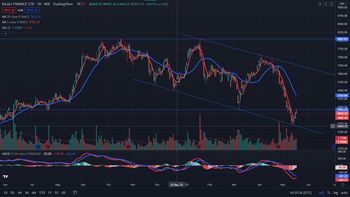
TECHNICAL ANALYSIS
• For the past 4-months the stock has been moving in a descending range
• In the MACD indicator, whenever the 12-day MACD curve (Red curve) cuts the 26-day MACD curve (Blue curve) and moves above the 26-day MACD curve. It gives the first indication to go long on the stock
• The stock has recently touched its bottom trend line and when the 5-day moving average curve (Red curve) cuts the 20-day moving average curve (Blue curve) and moves above the 20-day moving average curve. It gives the confirmation to go long. Check whether the volumes are higher than the 20-day average
Note: This is not a BUY/SELL recommendation. This is just an analysis for educational purpose