💡 Wipro 💡
Wipro Ltd is global Information technology, consulting, and business process services company. It is the 4th largest Indian player in the global IT services industry behind TCS, Infosys, and HCL Technologies
FINANCIALS 📊
• Stock is trading at a P/E 18.7 of while the industry P/E is at 25.1, the Debt-to-equity ratio is at 0.27, and ROCE at 21.1%
• In Q4FY22, revenue grew by 28.4% YoY, mainly due to strong growth across segments and geographic regions
• EBITDA rose 2.9% YoY, despite a significant reduction in EBITDA margin by 5% YoY, owing to higher operating expenses
• The PAT increased 3.9% YoY to INR 3,087 Cr
HIGHLIGHTS 📣
• Wipro has continued to post solid order bookings, fetch large transformation deals and rapidly expand in small and mid-sized deals. Wipro has also partnered with Microsoft to strengthen its business with Microsoft's Industry, Cloud-first Vision
• The demand for IT services remains strong, primarily due to the growing need for cloud-based software, emerging big data technology, and increasing investments in automated business processes, which should drive Wipro’s business forward
• IT Services revenue growth is expected at 1.0%-3.0% in Q1FY23
• Wipro recently announced two acquisitions. First acquisition of CAS (Convergence Acceleration Solutions) Group, a US-based consulting and program management firm, focusing on the communication sectors
• Second acquisition of Rizing, a global SAP consulting company, facilitating Wipro's SAP Cloud practice and Wipro FullStride Cloud Services
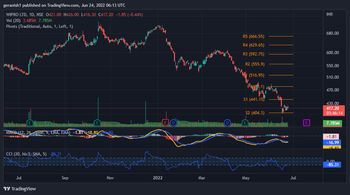
TECHNICAL ANALYSIS 📈
• CCI indicator shows the stock is at an oversold region
• The Pivot indicator shows that the stock has recently touched its support at INR 404.3 and started to bounce back. It gives the first indication to go long on the stock
• In the MACD indicator, the 12-day MACD curve (Yellow curve) is about to cut the 26-day MACD curve (Blue curve) and moves above the 26-day MACD curve, it gives the conformation to go long on the stock
I would like to hear your views. Please share it in the comments section
Note: This is not a BUY/SELL recommendation. This is just an analysis for educational purpose