💡 Tech Mahindra 💡
Tech Mahindra Ltd provides a comprehensive range of IT services, including IT-enabled service, application development and maintenance, consulting and enterprise business solutions, etc. to a diversified base of corporate customers in a wide range of industries.
FINANCIALS 📊
• Stock is trading at a P/E of 17.8 while the industry P/E is at 25.6, the Debt-to-equity ratio is at 0.1, and ROCE at 26.6%
• Revenue grew by 24.5% YoY in Q4FY22 to INR 12,116 Cr
• EBITDA margin fell by 230bps YoY to 17.2% due to increased subcontractor costs, higher employee costs along with lower utilization
• PAT grew by 39.2% YoY in Q4FY22, reaching INR 1,505 Cr
HIGHLIGHTS 📣
• Upon continuation of Hedge policy approved by Board, Forex gain rose to 63.5% QoQ
• Headcount grew by 4.2% QoQ to 1,51,173. The total number of active clients increased by 2.7% QoQ to 1,224
• New deal wins amounted to USD 1 Bn, constituting USD 366 Mn worth of deals from the Enterprise segment, and the rest USD 645 Mn from CME
• Bharti Airtel and Tech Mahindra announced a strategic partnership to set up a joint 5G innovation lab to co-develop and market 5G use cases in India. This will also bring customized Enterprise Grade Private Networks to the country and helps in the advancement of technology within the company
• Company announced a recent collaboration with Yellow.ai to work on next-gen conversational-AI solutions, and collaboration with Cisco, Celonis, APPSLINK, Ludium Labs, ASKA, and Nokia for the advancement in technologies and services offered
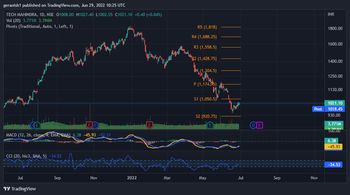
TECHNICAL ANALYSIS 📈
• Stock has been moving in a downtrend for the past 6 months
• The Pivot indicator shows that the stock went near its support at INR 920.75 and started to bounce back
• CCI indicator shows the stock is at an oversold region. It gives the first indication to go long on the stock
• In the MACD indicator, the 12-day MACD curve (Yellow curve) cuts the 26-day MACD curve (Blue curve) and moves above the 26-day MACD curve, it gives the conformation to go long on the stock. Check whether the volumes are higher than the 20-day average before entering the trading
I would like to hear your views. Please share it in the comments section
Note: This is not a BUY/SELL recommendation. This is just an analysis for educational purpose