Paytm, the stock that has given sleepless nights to many!!
Is it the right time to buy the stock?
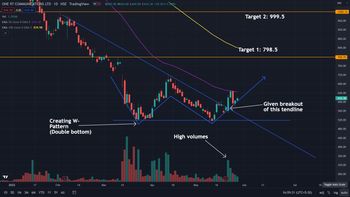
📈 Here's what Chart Suggests:
⚈ The stock has formed double bottom(W-pattern) on the daily charts. It suggests that there are high chances of stock reversal from here.
💡What is the double bottom(W-Pattern) pattern?
-> A double bottom pattern is a technical analysis charting pattern that describes a shift in the trend and a reversal of momentum from prior leading price action. It describes a stock or index drop, a rebound, another drop to the same or similar level as the first drop, and then another rebound. The double bottom resembles the letter "W." The twice-touched low is regarded as a level of support.
⚈ The stock has also taken out the trendline which it has been following since the past 2 months.
⚈ Stock is trading below its 50 & 100 days EMA.
⭐⭐One can start accumulating the stock at current levels⭐⭐
🚫Stop Loss: Closing below Rs 500(Weekly basis)
🎯Target 1: 798.5
🎯Target 2: 999.5
🌱 Fundamentals 🌱
⚈ Paytm has the largest customer base in the Indian market for digital payments, which means the company will do well in the long run.
⚈ Paytm is also in the banking business, and it anticipates that the central bank will allow it to resume accepting new banking customers in the coming months, which was previously prohibited.
⚈ According to management, the company is experiencing good growth in high margin businesses, and as a result, the company will be profitable very soon.
❮
❯