
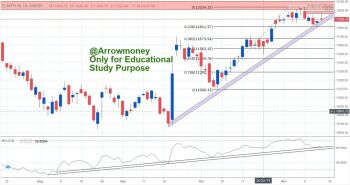
Nifty view for Upcoming week
- After Price Rejection from Daily Resistance zone: 12021-12103
- Price seen Taking support near 38.2%=11826 Fibonacci Retracement Level
- Price also Holding Trend Line Support near 11800
- RSI Shows Clear Trend Line Support on Daily chart
- on Short term charts Price Rejection seen from Resistance zone: 11966-11990
- Daily chart shows near Over-sold zone now
- Expecting consolidation in Triangle Pattern with Range 11800-12100
- Breakdown below 11800 will lead to next Fibonacci Retracement Levels
50%=11762
61.8%=11698 Level
- Breakout sustain above 12100 will lead towards 12300-12500 Levels
OI Data:
Weekly: Support 11800, Resistance 12000
Monthly: Support 11500-11600, Resistance 12000
Disclaimer: All the View/Study Given from Arrowmoney are only for Educational study purpose. Consult your financial adviser before making any investment decision.