
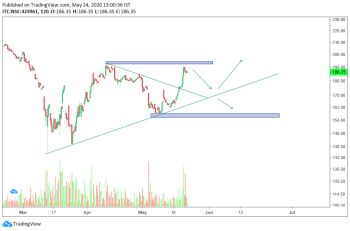
#ITC Chart Analysis, If Breakout Occurs Above The Resistance then the minimum targets would be 220. Prices can Come near the trend line considering it bounced back from the resistance, and again bounce back on the upside from there.
and if prices breaks the trendline (which is less likely to happen) the next significant support is at 155