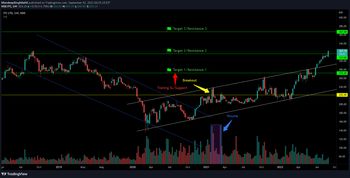
⭐️ Moved from 234.35 to 272.20 in Step1 (Resistance 1)
⭐️ Moved from 272.20 to 317 in Step2 (Resistance 2)
⭐️ It is now trading above Resistance 2 of 317
⭐️ Next Resistance is at 367 which will be our Target 3
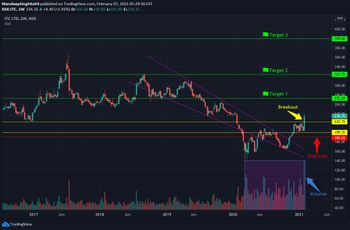
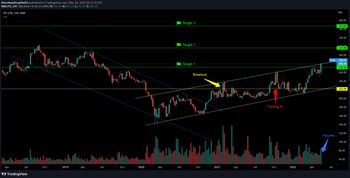
Breakout & follow up charts added for reference. Charts are self-explanatory. Levels of breakout, possible up-moves (where stock may find resistances) and support (close below which, setup will be invalidated) are mentioned on charts.
❮
❯