
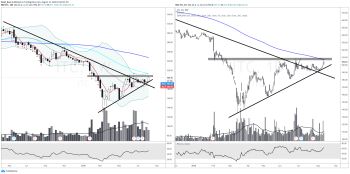
ITC Ltd. has witnessed breakout from the downtrend line and presently consolidating in an Ascending Triangle pattern.
Yesterday the stock faced resistance exactly at 200 SMA in the daily chart and breakout in the stock to take place only above 210 (given the stock sustains on hourly closing basis).
If the stock sustains above 220 level, there is a room for gap filling till 230 in the stock.
In the weekly chart, immediate resistance comes at 214 at 50 SMA and probable resistance in the medium term comes at 235-245 zone.
Technical parameters looks neutral as of now in the weekly chart.
Probable support in the stock post breakout comes at 203-207 zone.