IRCTC (Indian Railway Catering and Tourism Corporation) is a Mini Ratna (Category-I) Central Public Sector Enterprise under the Ministry of Railways, Government of India. IRCTC was incorporated on September 27th, 1999 as an extended arm of the Indian Railways to upgrade, professionalize and manage the catering and hospitality services at stations, on trains, and other locations and to promote domestic and international tourism through the development of budget hotels, special tour packages, information & commercial publicity and global reservation systems
FINANCIALS 📊
• Stock is trading at a P/E of 95.3, Debt to equity ratio is at 0.07, and ROCE at 11.6%
• IRCTC reported a massive 167.9% increase in net profit to INR 209 Cr in Q3FY22 from INR 78 Cr in Q3FY21
• Total income during Q3FY22, rose by 141% to INR 540 Cr, from INR 224 Cr in Q3FY21
• Q3FY22 EBIDTA increased to INR 279 Cr in comparison to INR 95 Cr in Q3FY21
PERFORMANCE 📣
• Catering services are being provided in 634 trains as compared to 572 trains Q3FY21
• Rail Neer’s capacity is of 15 lakh bottles per day and utilization was at 55%-60%
• Tourism segment was into losses as haulage charges of Tejas express trains were increased
• Ticketing mix as follows: 2nd class:- 40%, sleeper class:- 37%, 3rd AC:-15%, 2nd AC: 3%, 1st AC & executive: 1% and AC chair:-4%
• If diktat over convenience fee share was not withdrawn, IRCTC had the liberty to take corrective measures
• Further, events like the recent policy flip flop on convenience fee share with IR’s can result in a valuation overhang
TECHNICAL ANALYSIS 📈
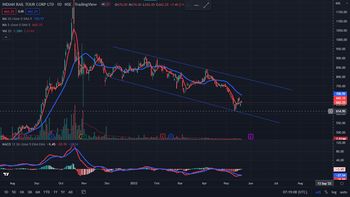
• For the past 6-months the stock has been moving in a downward trend
• In the MACD indicator, the 12-day MACD curve (Red curve) cuts the 26-day MACD curve (Blue curve) and moves above the 26-day MACD curve. It gives the first indication to go long on the stock
• The stock has recently touched its support and the 5-day moving average curve (Red curve) is about to cut the 20-day moving average curve (Blue curve) and would move above the 20-day moving average curve. Whenever it 5-day MA cuts and moves above the 20-day MA curve it gives the confirmation to go long on the stock. Check whether the volumes are higher than the 20-day average while entering the trade
Note: This is not a BUY/SELL recommendation. This is just an analysis for educational purpose
#TradingUniversity #InvestingUniversity #InvestmentIdeas