
GLENMARK PHARMA
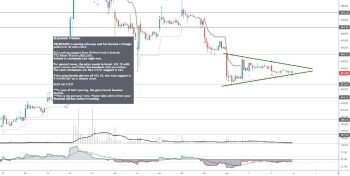
#GLENMARK is moving sideways and has formed a triangle pattern in 30 mins chart.
RSI is taking support from 40-level and is Bearish .
TT2 30min Trend is BULLISH .
Volume is extremely Low right now.
For upward move, the price needs to break 445.15 with good volume and follow the breakout with conviction. The next resistances are 464.7/475. Support is 423.
If the price breaks the low of 423.35, the next support is 414/398/387 on a 30mins chart.
KEEP AN EYE!!
***in case of GAP opening, the given levels become invalid.
***this is my personal view. Please take advice from your financial advisor before investing.