
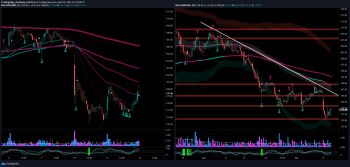
- Bounced from the convergence of weekly support zone and 50 SMA.
- In the daily chart, the stock bounced from 200 SMA along with positive divergence in RSI.
Levels Marked on Chart on my Tradingview account.
ENTRY/ EXIT/ TARGET - Details ONLY AVAILABLE in Premium Service Channel.
INDICATORS USED:-
1. Fibonacci Retracement
2. Volume
3. Open Interest Data
4. Valuation Bands by TradingEdge Academy
&
* Proprietary Indicator *
"Trend and Reversals with Volume" by TradingEdge Academy
For more information regarding our services, please contact us. Check my profile information for contact details.