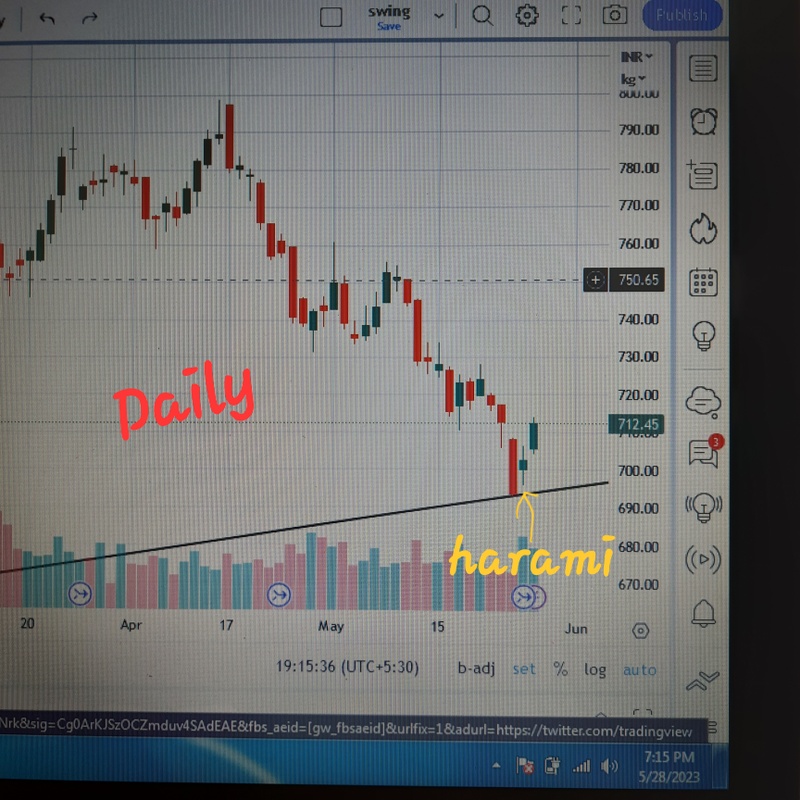
Copper chart shows buying signal.
On daily chart it has already shown a harami pattern on prior session, due to which these session in in green. Now it also has volume which indicates buying pressure.
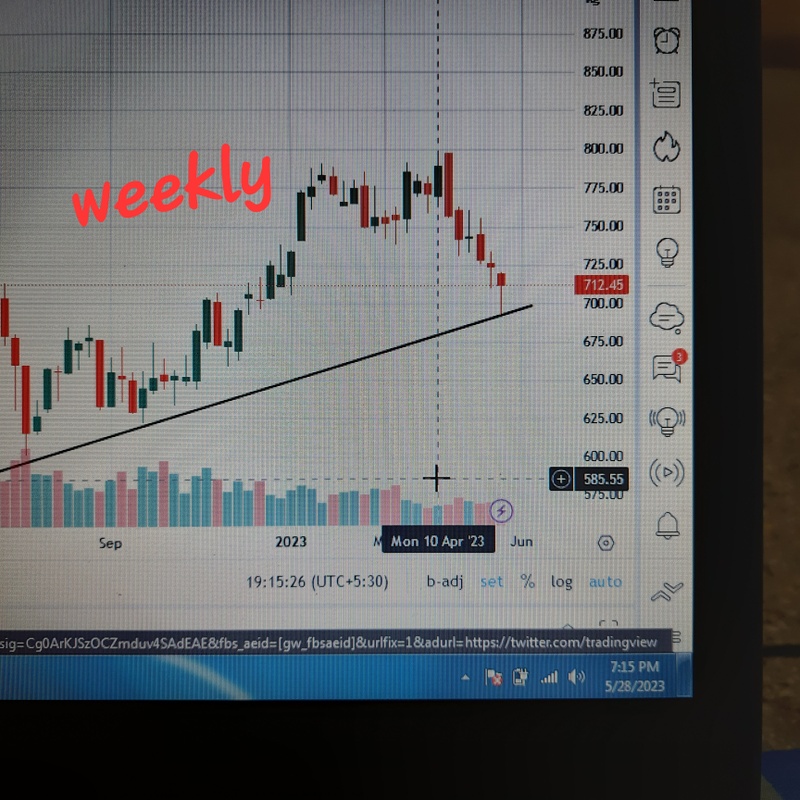
On weekly hanging man has formed.
(This is subjective as per my understanding and knowledge of candlestick. And I do not suggest anything)
Let me know if there is something I should have or should know and share your views on these.
❮
❯