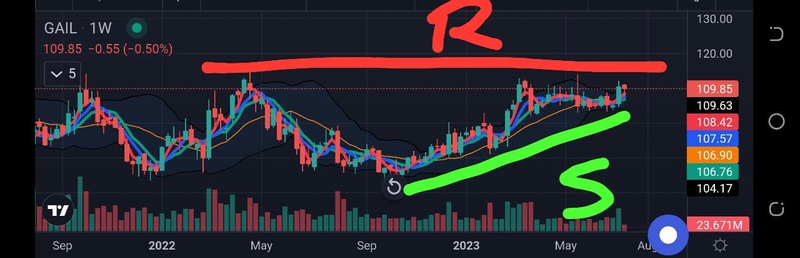
Weekly chart
R = resistance since a long time (hence 109 to 111 levels)
S = Support increase month on month (hence 89 to 92 levels)
We can expect a breakout only if the stock closes above 111 levels and holds for 1-week minimum. This will ensure any false breakouts are eliminated
Awaiting Q1 results
Disclaimer: For education and self-learning purposes only