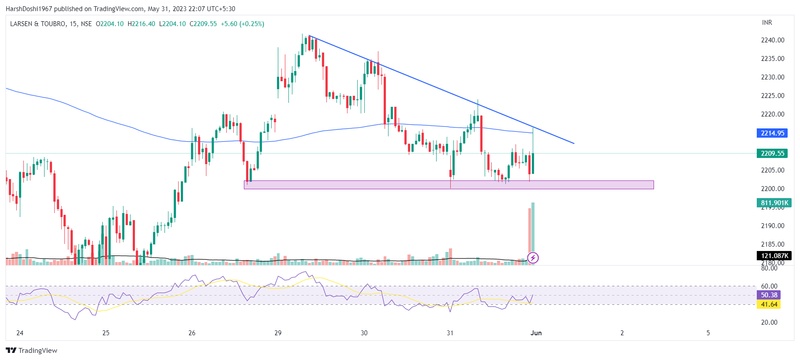
On the 15-minute time frame, Larsen and Toubro (L&T) has formed a descending triangle pattern, indicating a potential selling opportunity for intraday traders if the marked zone is broken. However, if there is a breakout from the falling trend, it could be seen as a bullish sign, and traders may consider a long position. Both scenarios present trading possibilities, and traders should monitor the price action closely to make trading decisions.