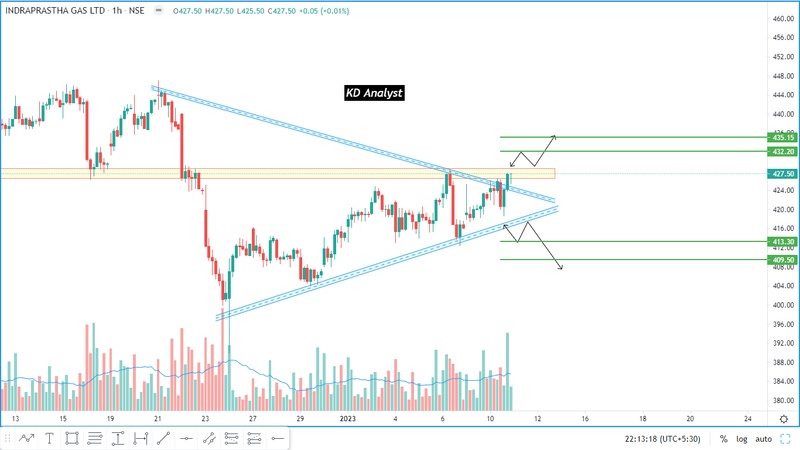
👉It has given a breakout of a Symmetrical Triangle Pattern.
👉it sustains above then good buying can be seen above 429.50
👉If this pattern fails then selling pressure will come below 425
👉This type of pattern always requires confirmation wait for the correct level to enter.
👉In last 15 M volume was above 20 MA.
👉Data is bullish for this.
Trade as per your own analysis and Risk reward.
Information share above is only my view and analysis based on price action.