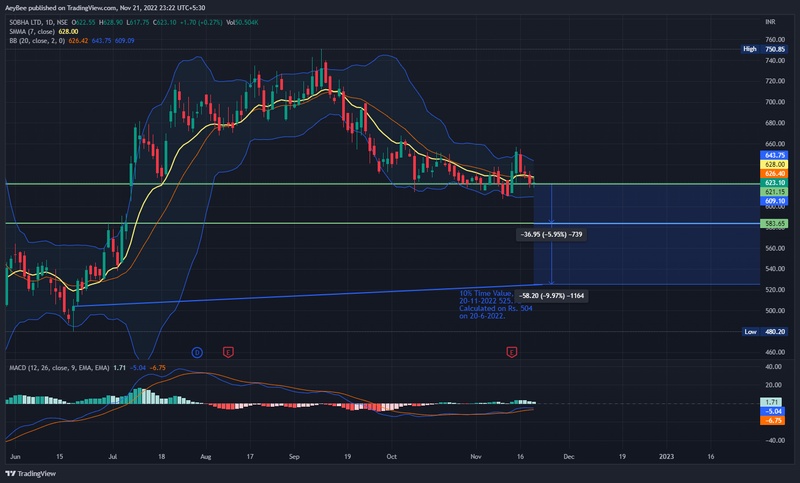
Analizing from 20-11-2022
20-11-2022 621.40 Bearish
Support Line at 583.65 6-7-2022
37.75 Difference
MACD Signal Line Below 0
SMA and Candle Touching
Candle Below SMA and BB
21-11-2022 Close 623.10 +1.70 (0.27%)
Strong Support Taken from 6-7-2022
from where Big Bull happend.
In 1Day Chart Candle in Green Color,
Which is Good Signal, But Nifty sensation are Negative,
Crude is on High side, Doller is on High side,
But,
in 1minute chart,
last candle is Red and below 621.15,
Which is Bearish signal.
Short on 618 will Suggested,
Stop loss 624
Target is depend on Greedyness
(on 21-11-2022 10 Rs differance in High and Low)
Educational,
Do Market Discipline.
Personal View
link
SOBHA 1 Min
❮
❯