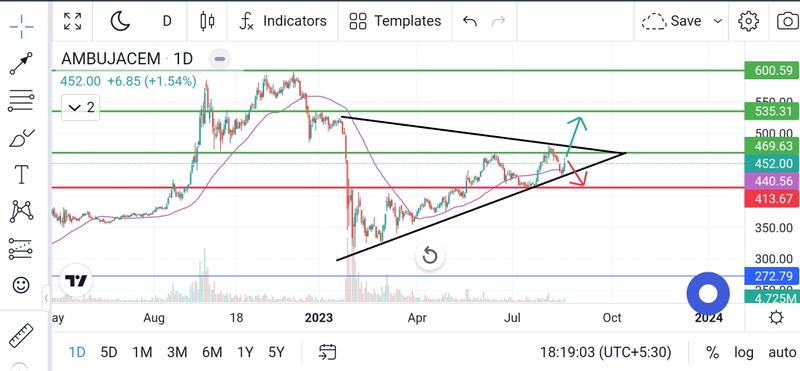
#AMBUJACEM ONE DAY CHART ANALYSIS 📉
🚨 Currently Stock in Trading in Triangle Pattern, Wait for A Perfect Breakout of the Triangle Pattern In Any Side for A Good Movement In Any Side
➡️ If It Break Upward Then Our First Target 🎯 will be 535 And Second Target 🎯 will 600 in Short Period ⬆️
➡️ If it Break Downward Then 413 Is A Major Holding Support , We can See Reversal From the Support ⬇️
➡️ The Stock can be in Range from 413 to 470 ✅
This Chart is For Educational Purpose Only 👨🎓