
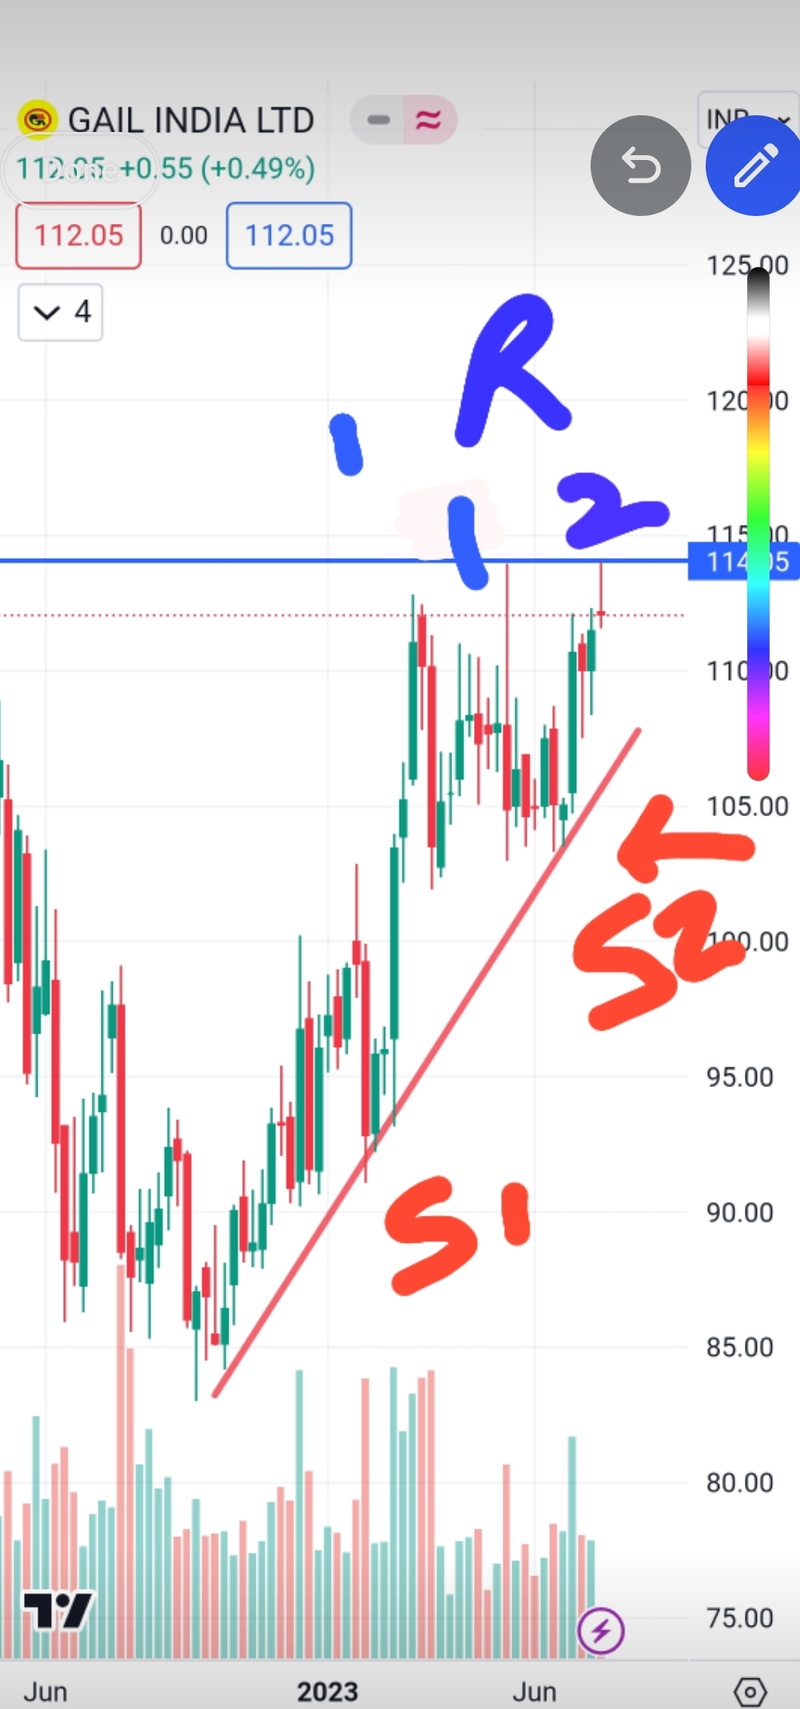
weekly chart
Today we saw a New weekly high but as we can see on the charts R 1 and R2 are near the same 114 levels. (looks like double top but the week is not over hence cannot confirm so early)
Massive profit booking between 113 to 114 levels which dragged the prices down to 112 levels.
Support has been rising as shown by S1 and S2 on the charts but it also means the stock can test the S2 in the next few weaks
Stock need to be above 111 levels for any upside move in the current week (expiry week).
For educational purposes only
link
GAIL Weekly