💡 KPIT 💡
KPIT is primarily focused on EV mobility software services with a market cap of INR 13,887 Cr. 42% of revenue comes from the USA, 41% from Europe, and 11% from the rest of the world. KPIT enables customers to accelerate the implementation of next-generation mobility technologies with development centers in Europe, USA, Japan, China, Thailand and India.
FINANCIALS 📊
• Stock is trading at a P/E of 50.7 while the industry P/E is at 28.8, the Debt-to-equity ratio is at 0.17, and ROCE at 24.5%
• Revenue was up 19.7%YoY in CC terms to INR 2,434 Cr in FY22
• EBITDA grew by 42.53% YoY to INR 439 Cr in FY22
• In FY22, net profit grew by 88%YoY to INR 274 Cr
HIGHLIGHTS 📣
• KPIT wants most of its revenue from the top 25 strategic customers. Currently, KPIT has 21 of the 25 strategic customers it needs
• The total headcount for the company stood at 8,245 at the end of FY22. The same was 6,366 as at the end of FY21. The revenue per employee has decreased in FY22 this was due to the account on recruiting more freshers
• In FY19, the management announced that they will reach EBIDTA margins of 18% from around 13% during FY19. Now the company has achieved it and the current EBIDTA margin is at 18.6%,
• Company got a huge deal of USD 125 Mn and another Euro 70 Mn in Q4FY22
• Majority of the project which KPIT is working on is to be delivered from FY25 onwards. So, any short-term impact in auto sales won’t impact KPIT
• In FY23, KPIT expects CC Revenue growth in the range of 18% to 21%, EBITDA margin to be in the range of 18% to 19%, and Volume Growth in the range of 25%
TECHNICAL ANALYSIS 📈
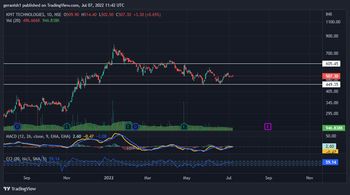
• Stock has been moving in sideways for the past 8 months
• CCI indicator shows the stock is moving towards the overbought region, it gives the first indication to go long on the stock
• In the MACD indicator, the 12-day MACD curve (Yellow curve) cuts the 26-day MACD curve (Blue curve) and moves above the 26-day MACD curve, it gives the conformation to go long on the stock. Check whether the volumes are higher than the 20-day average before entering the trading
I would like to hear your views. Please share it in the comments section
Note: This is not a BUY/SELL recommendation. This is just an analysis for educational purpose