View for tomorrow 14.07.2022- Multitime Frame review
Daily Chart
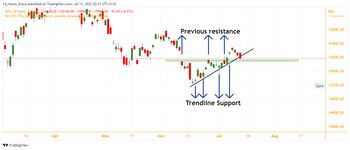
Area 15885-925 was earlier working as Resistance. Every chance, that it can work as support.
If Market open gap down below it, it can behave as a resistance again.
Hourly Chart
-Price has been forming LH LL (Downtrend pattern)
-Till the time it does not cross above previous supply zone, it is not positionally positive
15 mins chart
Gap down scenario -
Below green area- It can act resistance & fall
Above green area- Not going for CE, until crosses above 16010 & PE if closes down green area
Flat open- Same analysis apply
Gap up scenario
If open in highlighted yellow area and faces rejection. Forms a M pattern with neckline breakdown, then PE.
If crosses 16010 and closes, then a CE position to be taken
SL Strategy
SL shall be above or below the Key Areas (yellow or green) as the case may be.
❮
❯