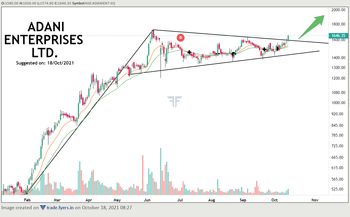
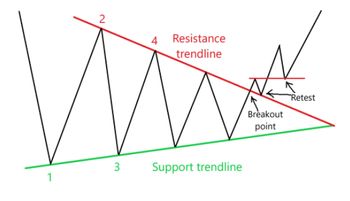
Adani Enterprises chart is forming a symmetrical triangle pattern (Attaching an image of this pattern below) and has given a breakout today. But, let me remind three situations that can be formed after a breakout:
1. The stock moves steadily upwards with full strength.
2. The stock retests the previous breakout level.
3. The stock breakouts but it might end up being a false breakout.
So never put a big chunk of money in a single trade, buy in small quantities.
Coming back to Adani Enterprises, the stock has today formed a bullish breakout candle, the levels to watch out for are 1700, 1800, 1900 with a stop loss (SL) of 1510.
Don't forget to buy only in small quantities.
Happy Investing !!!
❮
❯