
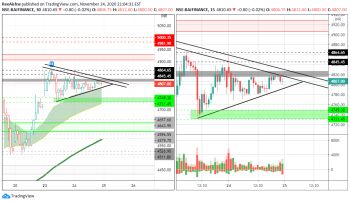
ALL THE LEVELS AND PATTERNS ARE MARKED ON CHART, RED ZONES DENOTES SUPPLY ZONES AND GREEN IS FOR DEMAND ZONE .
BUY ABOVE 4845-4865 IF THE LEVEL IS BROKEN WITH VOLUME AND CONVICTION.
TELEGRAM CHANNEL: https://t.me/tradingedgeacademy
The indicator used:
1) Daily Lines plots Daily 20 (BLACK) & 50 EMA (GREY) on lower time frame charts
2) TE-REKAB
- PB : PULLBACK
If you like the analysis, do leave a like and follow for more such content coming up.
The analysis is my POV, hope you got bucks in your pocket to consult a financial advisor before investing :P :)
HAPPY TRADING!