
ULTRACEMO - S below 3790 TGT 3750
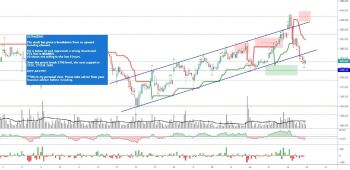
The stock has given a breakdown from an upward trending channel.
RSI is below 40 and represents a strong downtrend.
TT2 Tool is BEARISH .
VD shows net selling in the last 5 hours.
Once the prices break 3790 level, the next support is 3750, 3710 & 3680.
KEEP AN EYE!!
***this is my personal view. Please take advice from your financial advisor before investing.