"Picking the Perfect Entry: How the 20 Simple Moving Average Can Supercharge Your Trading"
A 20-day Simple Moving Average (SMA) strategy is a simple but effective technical analysis approach used by traders and investors to make decisions in financial markets.
SMA is a moving average that calculates the average closing price of an asset over the past 20 trading days. Here's a basic trading strategy using the 20-day SMA
20 Moving Average Setup:
1. Plot the 20 SMA on the chart
2. Stock is said to be bullish when the price crosses over the 20 SMA
3. Stock is said to be bearish when the prices crosses below the 20 SMA.
Possible moves/scenarios in 20 SMA and entry
1. Price crosses above 20 SMA
Mark the high/closing of the 20 SMA breakout candle. Prices closing above the candle can take a trade.
Stop loss - low of the breakout candle
2. Price crosses below 20 SMA
Mark the low /closing of the 20 SMA breakdown candle. Prices closing below the candle can take a trade.
Stop loss - low of the breakdown candle
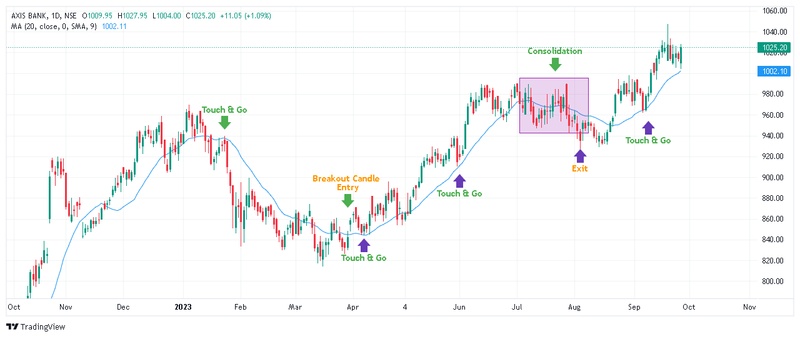
3. Prices taking support/rejections at 20 SMA
This is mostly called "Touch and Go" - means price comes down and test the 20 SMA and moves/down again(Reversal)
4. Prices consolidation - Refer chart of reference