
NMDC
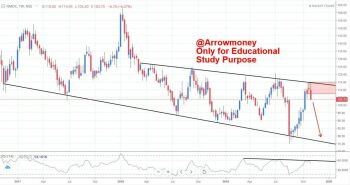
- Strong Weekly Down trend to sideways Channel
- Price Rejected From Weekly Strong Trend Line Resistance near 115
- Formed Strong Resistance zone: 107-115
- Possibility to Extend this Weakness towards TGT Levels 100-90-85
- Next Range Support near 75 to test
- RSI Clear weakness with Resistance on Weekly chart
OI Data: 110 Strong Resistance, 100-90 Support
Disclaimer: All the View/Study Given from Arrowmoney are only for Educational study purpose. Consult your financial adviser before making any investment decision.