
What's the trade?
I think the trade is on the short side. I have decent short positions across futures, next week puts, month end puts and SGX futures. Most importantly, I am also short on front-page :)
Why?
- FIIs turning defensive/bearish. Look at options data (selling calls and buying puts). Neutral across cash and futures market
- Failed bank nifty breakout
- Ugly nifty closing for the week. inverted hammer after a big upmove - see weekly chart
What should you do?
- If you are long only - wait for the correction to get over and buy midcap financials when the market dips.
-If you want to hedge but don't like or understand options - sell Nifty and Bank Nifty futures.
-If you are a trader - buy puts on intra-day upmoves and remember to reduce shorts EoD. During a correction, the market opens gap up on nearly 50% of the days and options bleed 30% or more on market open.
What's the target?
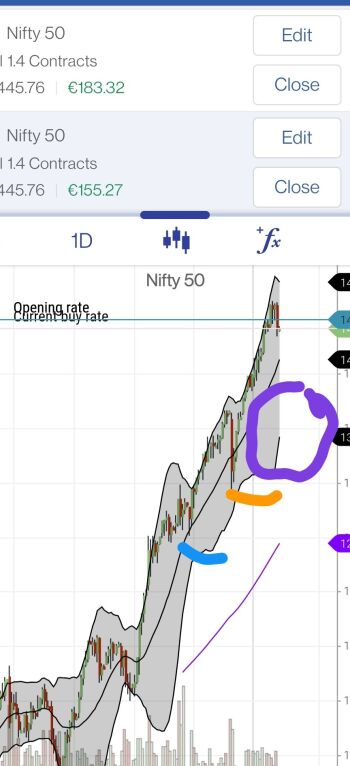
See chart below.
Blue line - Market corrected upto middle of Bollinger Band (daily)
Orange line - Market corrected halfway into bottom half of Bollinger Band
Purple circle - Target would be lower end of Bollinger Band. Currently around 13600 on Nifty
How to manage risk?
A new high should be the stop loss.