BSC News:
Nifty This Week: Technical Charts And More – Banks Need To Pitch In Now
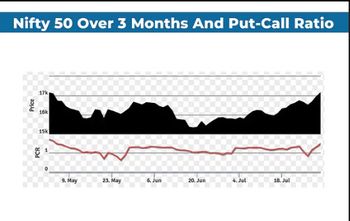
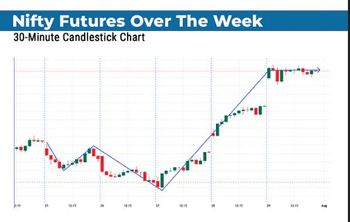
When the market began the week, it didn’t look like it would take off as it did but really got into a stride after Tuesday and didn’t stop right into Friday. There was some bearishness built into the options side on Monday, and it seems like the professionals got into the act around the lows of Wednesday morning and didn’t let go. The first chart shows the moves over the week.
Trends were helped by two gaps up. It was evident that the market had got reconciled to the U.S. Federal Reserve meet and once the event was past us, the pent-up demand was released and shorts
were squeezed as prices moved higher. Friday was more of a flat day but the important thing is that the indices held their levels. Evidently, sellers were unwilling or buyers were still around. Both of these are good news for some continuation of the trend.
It was largely owing to option trader activity that the prices jumped much. That and the fact that the Fed did not spring any surprises. The put-call ratio, which has run comfortably above 1 for much of the month, suddenly dropped below 1 for a couple of days as the high levels saw profit taking by earlier bulls and bolder bears came out of their caves, expecting global volatility to increase with the Fed and other events. Sensing an opportunity, the smart set seized it and a sharp spate of short covering occurred. At the turn of the monthly expiry too we found that the overall Open Interest was quite low as retail trade too had let go of much of their positions and despite the higher index levels, the positions were actually quite light. This has given a further fillip to the option traders and OI on Friday pushed up swiftly to 1.48 levels. The second chart shows the trap of the sellers last week.
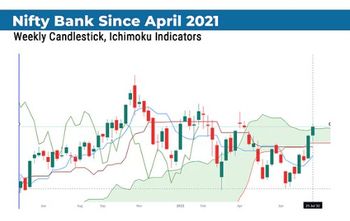
Here all systems seem to be Go! Prices are clear of the cloud and more importantly, the Chikou span line too is cleared it. The Tenkan-sen Kijun-sen lines are also about to do the same. In the earlier article, I had mentioned how the Kumo cross held out for some more gains. Well, we got it now. The two
indicators are in good form with the ADX line too on the rise now and the RSI in fine form with a support dip to 60 levels with that minor dip of early this week.
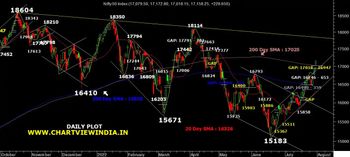
All of them point north, so the obvious thing to do is to buy dips ahead. This would be around 16,500-16,600 area.
A good recovery has been seen in the banking area and this is important for the Nifty too as a bulk of the weight is still coming from there. PSU banks were in good form and now SBI results are left to come and if that too comes out well, we may see some further push to PSU banks. Results from private banks were okay but the market has not been too kind. They need to move too for the Nifty Bank index to get cracking. It is poised to do it. But needs that nudge from private banks. That is one of the things to look for in the week ahead. The fourth chart shows the Bank Nifty poking above the cloud on the weekly chart.
The other sector that had been mentioned earlier, auto, continues to be in good form. But the stronger move came from the FMCG sector index as it has been rallying and is now on the verge of punching to new highs. Many thanks are due to the move in ITC and some overall up moves in many names from the sector. So, perhaps there could be some action still left in that sector for the week ahead.
What about trailing stops on longs? Well, the support zone at 16,500 would also act as the first stop for very active traders. A slightly further one could be around 16,380 area.
We shall leave it there for now. Odds are for continuation. Sectors have been identified. Generally, if prices move when people are not ready, then a variety of stocks would be moved to lure in the latecomers. I expect something like that may happen. A target of 17,300-17,400 may now become likely.
Trade setup for Monday: Top 15 things to know before Opening Bell
Based on the open interest future percentage, there were 111 stocks including Delta Corp, Chambal Fertilizers, Max Financial Services, Cipla, and SBI Life Insurance Company, in which a long build-up was seen.
We have collated 15 data points to help you spot profitable trades:
Note: The open interest (OI) and volume data of stocks given in this story are the aggregates of three-month data and not of the current month only.
Key support and resistance levels on the Nifty
As per the pivot charts, the key support level for the Nifty is placed at 17,060, followed by 16,962. If the index moves up, the key resistance levels to watch out for are 17,215 and 17,271.#NIFTYBANK #NIFTY50 #MacroEconomy
❮
❯