💡Cipla – Q1FY23 Results💡
• Revenue fell by 2.3% YoY to INR 5,375 Cr
• Net Profit was at INR 686 Cr, down by 4% YoY
• Cipla saw strong growth in India and US but it took a fall in South Africa and Sub-Saharan Africa
• The strong growth in the second term was offset by the forex volatility in emerging markets and the muted B2B growth in Europe.
• With global seedings and lockins, the API business maintained its traction.
MARGINS 📊
• EBITDA was down by 15% YoY to INR 1,143 Cr but on a QoQ basis, it grew by 50%
• Cost rigor and calibrated pricing actions have aided in insulating margins from inflationary cost factors and maintaining high serviceability.
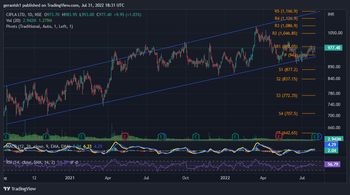
TECHNICAL ANALYSIS 📈
• Stock has been moving in a range for the past 2 years and the stock is trading at its support level right now
• RSI indicator shows the stock is moving towards the overbought region, it gives the first indication to go long on the stock
• In the MACD indicator, the 12-day MACD curve (Yellow curve) cuts the 26-day MACD curve (Blue curve) and moves above the 26-day MACD curve, it gives the conformation to go long on the stock. Check whether the volumes are higher than the 20-day average before entering the trading
I would like to hear your views. Please share it in the comments section
Note: This is not a BUY/SELL recommendation. This is just an analysis for educational purpose