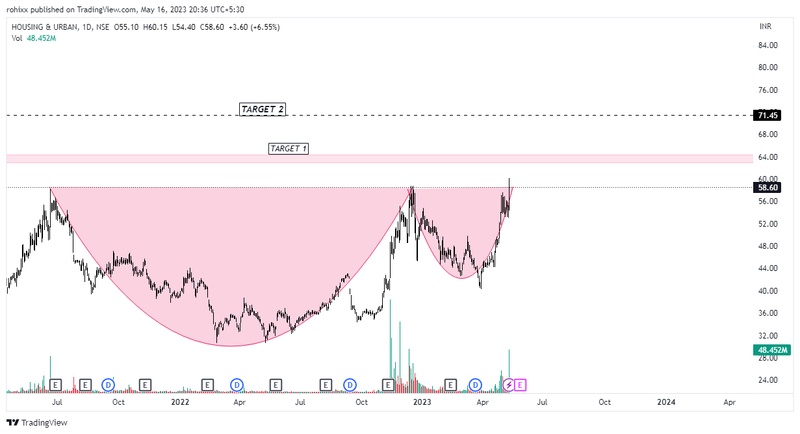
TIME FRAME : DAILY
After almost 700 days the price has broke the resistance level with a very high volume and now it is forming a CUP & HANDLE pattern. Good to long from here.
Indicators such as MACD, RSI, EMA, PIVOT are in favour of long.
T1 : 63 - 64.90
T2 : 71.45
SL : RECENT SWING OR BELOW THE BREAKOUT CANDLE
In 15 mint chart frame it broke out and retested the zone. Enter above 59.25
Please correct me if i am wrong. Thank you.