The trade is over but it is classic example of confluence of various factors and a high probability trade.When u come across such a trade u can trade with multiple lots and aggressively
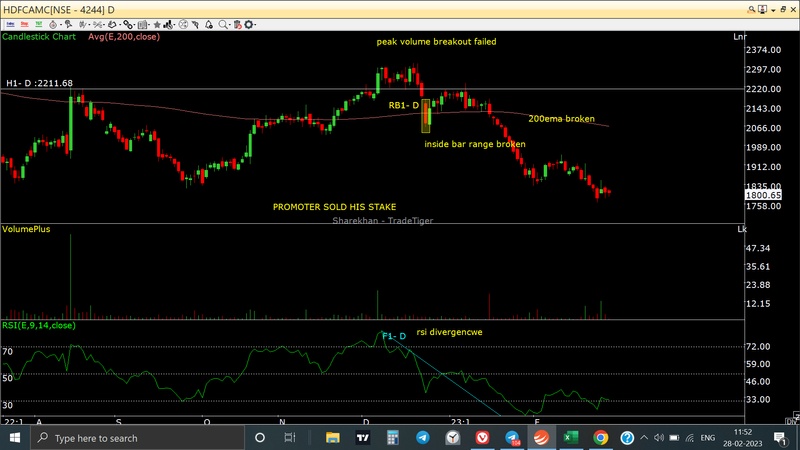
1.around 7 dec there were news of promoter selling his stake and there was apeak volume breakout in the stock.The breakout failed and hence the people who were long started to exit causing the price to go down.
2.At the same time u can see negative divergence in RSi
3.around 15th jan there was a clear H&S pattern on the chart Subsequently the neckline broke,200ema broke ,the range of the inside bar broke and look at the downfall.
Such one trade is enough to earn u for 2-3 months
Tip:
H&S pattern,double top etc is more clearly visible in line charts
Rounding bottom ,cup&handle is clearly visible in bar charts