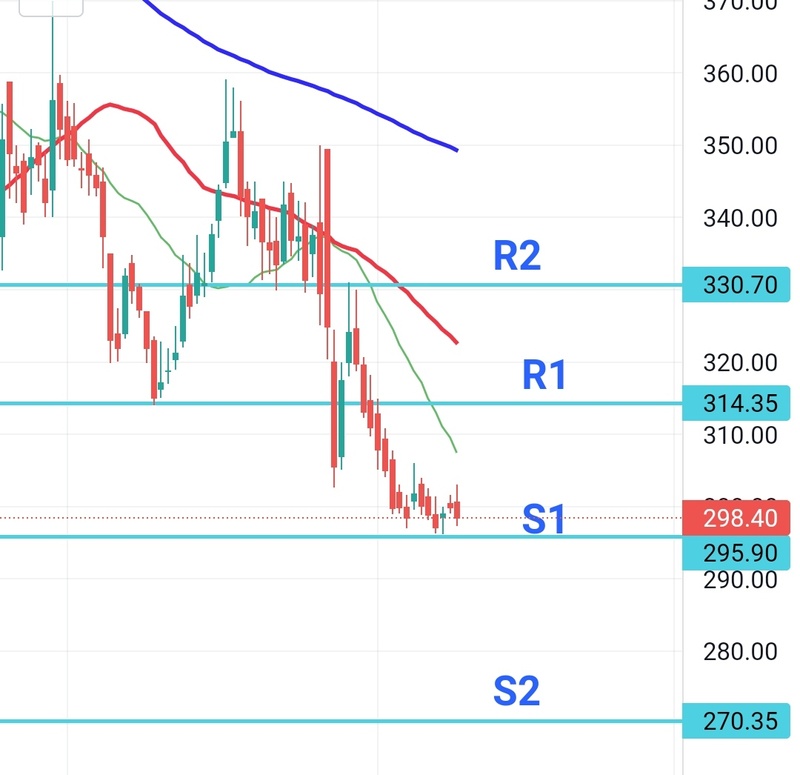
Vaibhav Global is on it downward journey towards 52 week low. In daily charts price is below all 3 EMA. If the result is not that good this quarter, the stock may test pretty lower levels.
In recent history stock has shown sharp upmoves like 30-40% in a single month. So a bounce back from 52 week low prices may be a good sign.