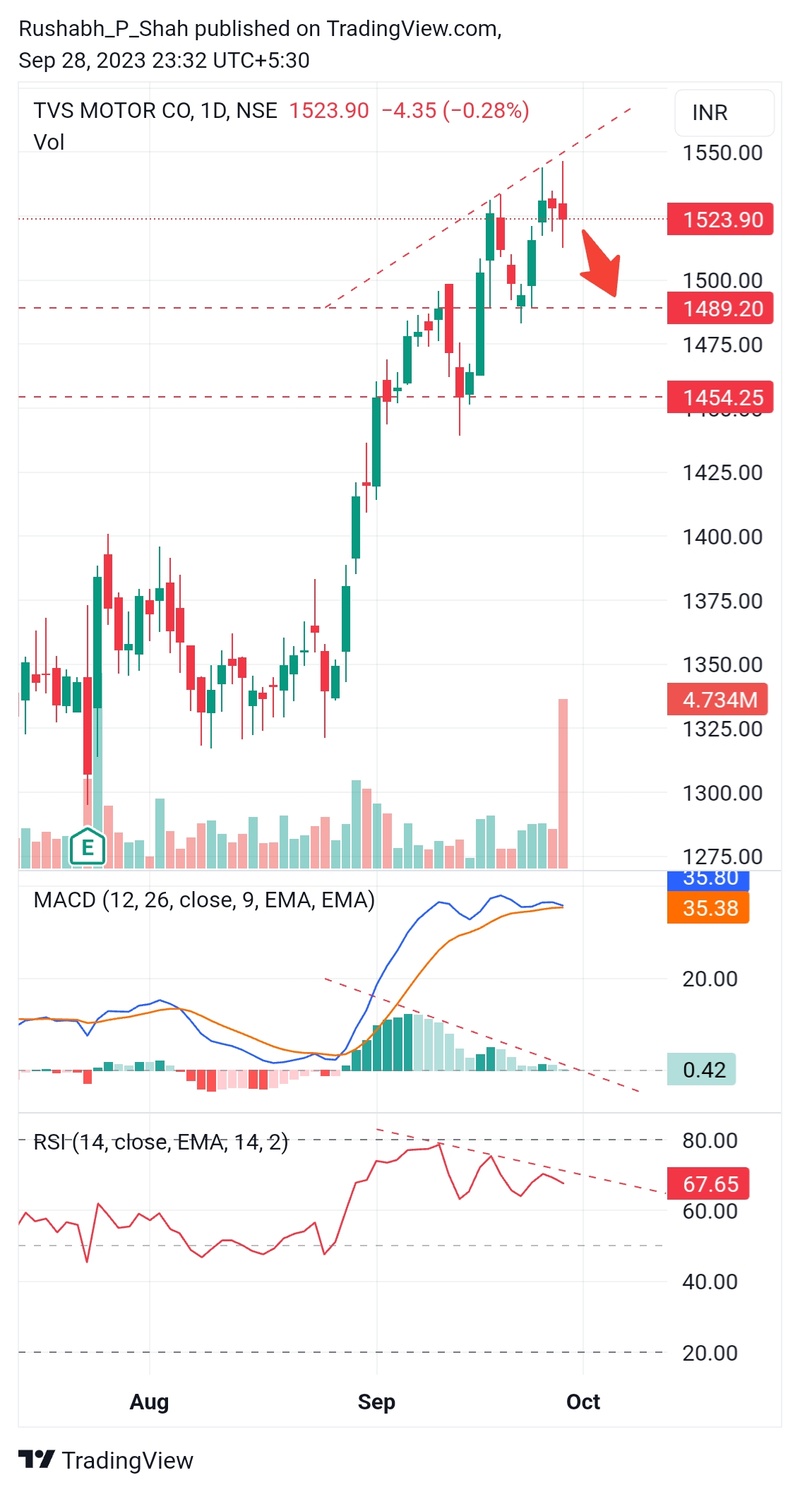
TVS Motors Price Action Breakdown -
Daily candlestick pattern suggests a selling pressure around its all time high zone of 1550 - 1540. Candlesticks have formed a higher high whereas RSI has formed lower highs indicating a clear bearish RSI divergence, also MACD histogram pattern indicates bearish divergence. MACD also seems to be at a negative crossover. Notice the daily spike in selling volume. If price falls below 28th Sept 2023 day low of 1515.55, the stock will fall down to 1489.20 which will act as a critical support, a breakdown of this level will drag TVS Motors to 1454.25. Upside seems unlikely as weekly and monthly RSI are above overbought level of 80. A stoploss of 1545 can be considered for downside targets of 50 - 80 points.