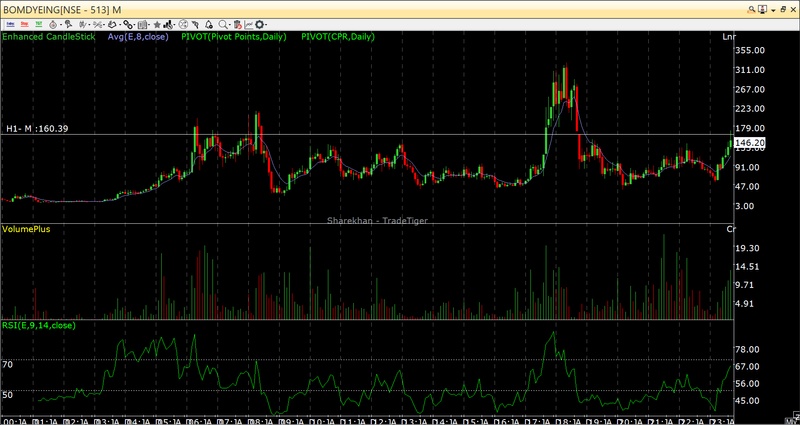
Very interesting chart of bombay dyeing.
Very rarely do we see a gap on monthly time frame chart
U can see that there is a shooting star candle on the charts and the price is unable to cross the gap border.It would be a great case study whether the price will go down or cross the border and go high?