Technical Observations:
USDINR October fut. formed a small body indicating consolidation in the range after a recentsurge.
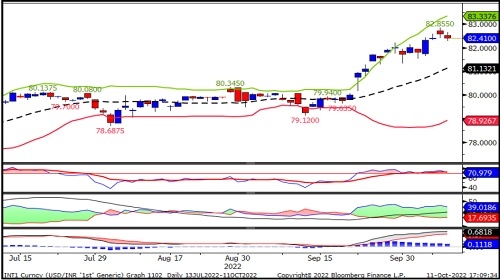
The pair has been trading well above short-term moving averages on the daily chart.
It has resistance at 83.34, the upper band of the Bollinger band and support around 81.10.
Momentum oscillator, RSI of 14 days period placed in an overbought zone might exit from the territory which could push the pair lower in the coming days.
However, the trend remains bullish following strong MACD and higher tophigher bottom formation on the daily chart.
USDINR Oct. fut. Is expected to trade in the range of 81.90 to 82.80.
USDINR October Futures Daily Chart