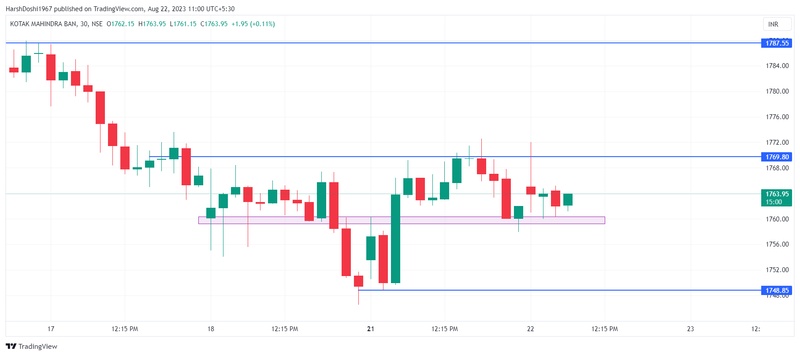
Kotak Bank's price chart is showing the formation of an inverted head and shoulders pattern, a bullish reversal pattern. The neckline, which connects the highs of the shoulders, is at the critical level of 1770. If the price breaks above this level and sustains , it could indicate a potential bullish momentum. Traders might consider looking for long opportunities if the price successfully surpasses 1770, targeting levels around 1780 and potentially higher.