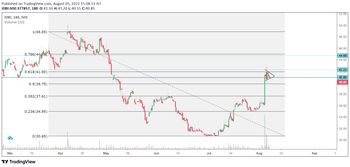
#IDBI - spotted a pennant formation on a 3hr chart of IDBI bank, the lower side of the pennant is a long-standing support line according to historical prices and the upper side is a Fibonacci 0.618 level. This formation generally suggests a breakout on the upper side. A good long position can be created on the upper side with a target of around 10% if the price moves along the lines. Potential fake breakouts can be avoided if a trading signal is clubbed with confirmation from RSI and a double EMA of 50 and 200.
Disclaimer:- This post must be taken as a mere trading opinion and not a trading advice.