
Double Bottom Pattern
Feedback
Gyanee's Post 
Reputation: 9,110 • Jul 29, 2023 3:43 AM
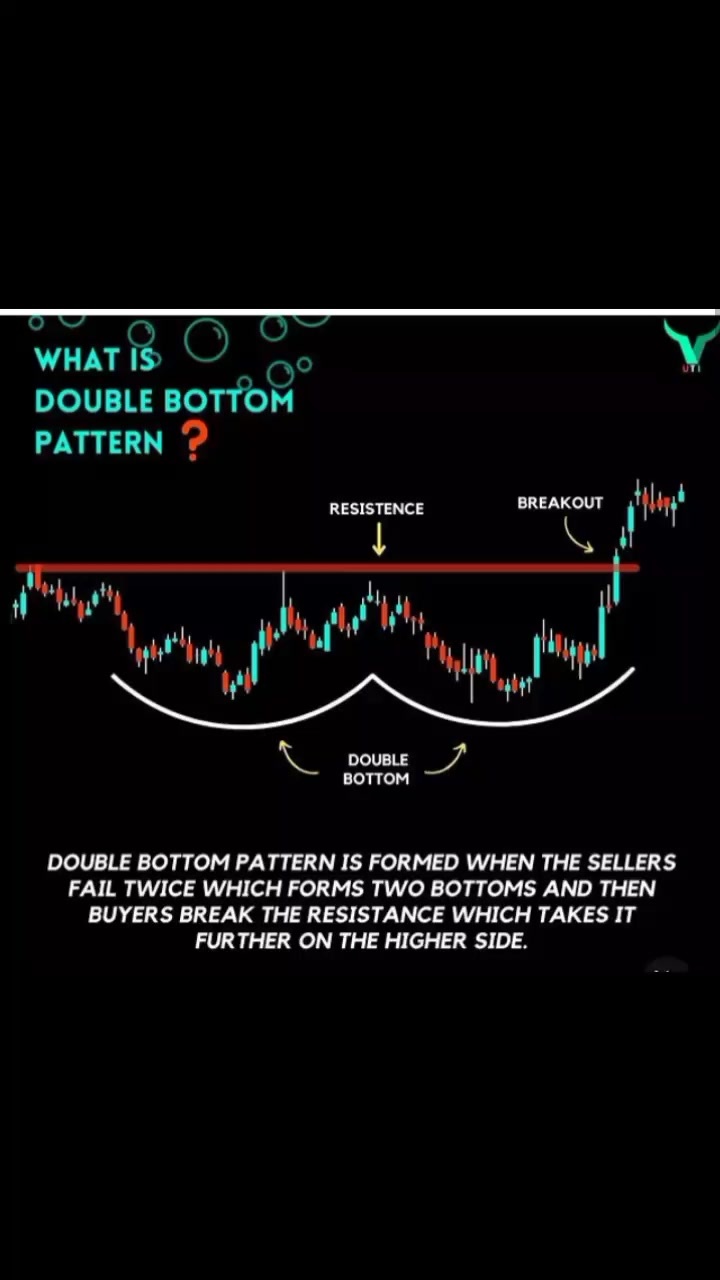
Double Bottom Pattern-It is formed when stock prices reaches a lower price two consecutive times with minor rises in between , creating W Shape on chart. This pattern indicates bullish reversal in trend which occurr when stock price breaks neck line on the upside.
#doublebottom #tradingpattern #continuation #trading #investment #technicalanalysis #FundamentalAnalysis #knowledge #sharing #bullish #learning | Gyanee | A$ymptomatic · Drone
3 views, 0 likes, 0 comments, 0 shares, Facebook Reels from Gyanee: Double Bottom Pattern-It is formed when stock prices reaches a lower price two consecutive times with minor rises in between ,...
@FacebookWatch
Vote
Comment
Share