💡 Zomato – Q1FY23 Results 💡
• Revenue was up by 67.44% YoY to INR 1,413.9 Cr
• Net losses were at INR 186 Cr, which was nearly half of the loss of INR 359 Cr in Q1FY22
• Average monthly transacting customers have grown by 36% YoY, while average monthly order frequency has grown by 10% YoY
• With the shift in the market environment, focus on profitability has become more intense recently without sacrificing the commitment to growth
• Due to rising fuel prices and wage inflation, the margins are getting negatively impacted
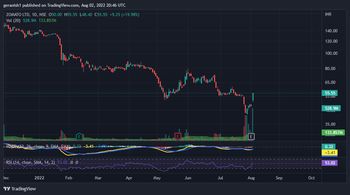
• Due to the positive results the stock gains 19.98% on August 2, 2022, and the momentum is expected to continue
TECHNICAL ANALYSIS 📈
• RSI indicator shows the stock is moving towards the overbought region, it gives the first indication to go long on the stock
• In the MACD indicator, the 12-day MACD curve (Yellow curve) is about to cut the 26-day MACD curve (Blue curve) and moves above the 26-day MACD curve, if it cuts and moves above it gives the conformation to go long on the stock. Check whether the volumes are higher than the 20-day average before entering the trading
I would like to hear your views. Please share it in the comments section
Note: This is not a BUY/SELL recommendation. This is just an analysis for educational purpose