🤌Types of Trends; How to identify them?
🌟 When investing or making a trade, it is critical to identify the trend first.
It increases the likelihood of success and aids in determining the entry and exit points for a trade or short/long term investment.
🌟 Today, we'll learn about the market's major trends and how we can use them to make trades and investments.
🤔 What is a Trend 🤔
When the price moves in one direction, such as upward, downward and sideways, this is referred to as a trend. Several traders employ trend trading strategies because the trading market has an element of predictability that allows traders to analyse and utilise it.
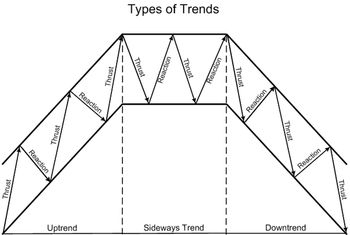
📜 Different types of Trends:
In technical analysis, trendlines or price action are used to identify trends.
There are three types of trends: upward, downward, and sideways.
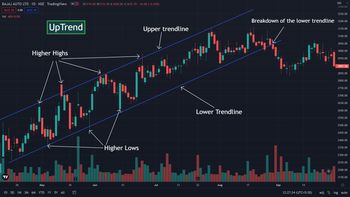
📈 Uptrend(Chart 1) 📈
An uptrend occurs when a stock makes higher highs and higher lows while moving. An uptrend is distinguished by a general increase in price. Because nothing moves straight up for very long, there will always be fluctuations, but the overall direction must be upward.
💡Example: We can see an uptrend in Bajaj Auto stock charts(First Chart). Stock is making higher highs and higher lows. We can draw a channel to identify the range of the price movement.
💰Entry💰
When the price reaches the lower trendline, one can buy the stock because it usually bounces back to make new highs.
🚫Exit:
When the price breaks the lower trendline and begins trading below it, it is time to sell the stock and even consider shorting it.
💡 If the price breaks the channel's upper trendline, it is considered a breakout and will result in a sharper upmove.
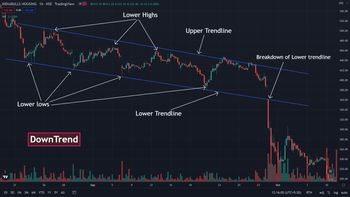
📉 Downtrend(Chart 2) 📉
When the stock price makes lower highs and higher lows, the stock is in a downtrend. In the case of a downtrend, trend traders make their way and enter a short position when the price is set to break the lower trendline or is facing resistance at the upper trendline. We can draw a channel to identify the range of the price movement.
💡Example: We can see a downtrend in IBulhsgfin stock (Chart 2). The stock is making lower highs and higher lows. We can draw a channel to identify the range of the price movement.
💰Entry💰
A short position can be taken when the stock price encounters resistance at the upper trendline or breaks the lower trendline.
🚫Exit:
When the price breaks through the upper trendline and begins trading above it, it is time to exit the short position. One should also consider purchasing the stock because it may be a trend reversal.
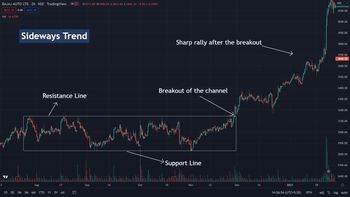
🗠 Sideways Trend (Chart 3) 🗠
A sideways trend develops when the market remains stagnant, i.e., the stock price does not reach the highest or lowest price points, or when a stock price is trading in a range and making the same highs and lows repeatedly. Several professional trend traders completely ignore this sideways trend. However, scalpers benefit with the help of short-term investments in the market to take advantage of a sideways trend.
⏩ Who are scalpers/ What is scalping❓❓
Scalping is a trading strategy that uses small price changes to generate large profits. Scalpers trade frequently and in short bursts. A scalp trader must have a strict exit policy because one large loss can wipe out all of his previous small profits.
💡Example: The Bajaj Auto stock is trending sideways (Chart 3). The stock is trading in a narrow range, repeatedly making the same highs and lows. We can draw a channel to identify the range of the price movement.
💰 Entry💰
Depending on whether it is a breakout or a breakdown, one can enter on either side. When the stock breaks the channel on either side, it usually makes a sharp move which can give you good profits in less time.
✨ Pro Tip✨
➡️ Always look at trend before taking any shot/long term investment decision.
➡️ If you trade in a sideways trend, your money will be stuck for the duration. A sideways trend can be as long as 5 years. So it's best to wait for the trend to break.
➡️ Maintain strict stop-losses because a breakout of the trend will result in sharp price movement, potentially resulting in higher losses.
😄 Please post your queries/doubts in the comment box 😄
✨Stay tuned to learn about the major chart patterns and how to trade them ✨
❮
❯