
#TIINDIA WEEKLY CHART VIEW!!
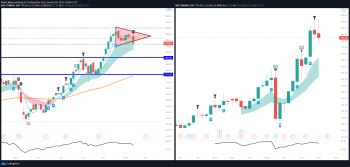
Tube Investments of India Ltd. The stock price had broken symmetrical triangle pattern in the weekly time frame.
Further weakness below 770 may try to increase negativity towards 750 .
On the upside resistance comes at 800-(5MA) :810.