About Company:
Tech Mahindra (TechM) employs over 1.2 lakh people in 90 countries, serving 1000+ clients with a focus on telecommunications (40 % of revenues). Apart from telecom, the company also serves BFSI, manufacturing, and retail. TechM has grown organically and inorganically (a 6.6 % dollar revenue CAGR over the last five years).
Fundamental Analysis:
-> Ruppe is depreciating and in a downtrend, which is why the share price is weakening.
-> Furthermore, the global IT market is in a correction phase, which is affecting the share price.
-> Deal wins, traction in the communication segment driven by legacy modernisation, 5G, customer care, automation, network, and cloud to drive future revenues.
-> Margins would be impacted in the short term due to higher employee and subcontractor costs, but they are expected to recover in future.
-> The company's dollar revenues increased 4.9 percent year on year, while CC revenues increased 5.4 percent.
-> EBIT margins decreased 160 basis points year on year, to 13.2 percent.
-> According to the company, communication will continue to be a growth driver for TechM in the future.
Technical Analysis:
-> It is currently in a downtrend, with the stock trading below the 200, 100, and 50 day EMAs.
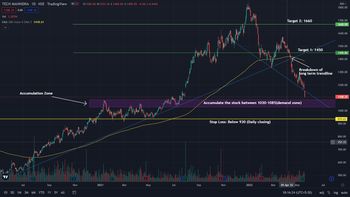
-> It recently broke through a long-followed trendline, resulting in sharp and heavy selling in the stock.
-> More downtrend is likely in the coming sessions, and it may retest the critical support that previously acted as resistance.
-> Going forward, it can trade in the Rs 1030 - Rs 1080 range, which is a good demand zone. If it breaks through the downside range, it may retest Rs 1000.
⭐ As indicated in the chart analysis, one can accumulate shares in the range of Rs 1030 - Rs 1080.
1st target: Rs 1450 (Time frame: 4-6 months)
2nd target: Rs 1660 (Trail your stop loss to buying price) (Timeframe: 6-9 months)
Stop Loss: Closing below Rs 930 on a daily closing basis.
Disclaimer: The information shared above is only for educational purposes. Please consult your financial advisor before making any financial decision.