
#TCS WEEKLY CHART VIEW!!
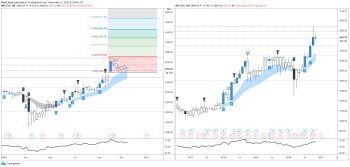
Tata Consultancy Services Ltd. is trading in narrow range. Technical indicators are bullish.
If price trades above narrow range 2885 near by Fibonacci resistance is 3122 and if price trades below narrow range 2600 near by support is mid bollinger band 2445 on weekly chart.