
After a gap-down opening on the back of weak overnight cues, Indian stock markets recovered sharply and closed near the day's highs on May 2.
The National Stock Exchange’s benchmark Nifty 50 ended the day with a minor loss of 33 points to close at 17,069. The recovery was led by banking, fast moving consumer goods (FMCG) and metal stocks. Consumer durables, auto and information technology (IT) stocks ended in the red.
Last week, Nifty failed to surpass the previous swing high resistance of 17,414 and formed a lower top at 17,377. Nifty recently breached the crucial supports of 20 and 50 days EMA (exponential moving average), which indicates that the short-term trend has turned weak.
Indicators and oscillators on the daily and weekly charts have turned bearish. Therefore, unless the Nifty closes above 17,400, the short-term trend will remain bearish.
Nifty has formed multiple bottoms around 16,900 levels. If we were to consider the entire upswing from 15,671 (March 8, 2022 low) to the recent swing high of 18,114, 50 percent of that move is placed at 16,893 levels. The 200-day EMA is currently placed at 16,870-odd levels. Therefore, we believe that on the downside, multiple supports are placed in the vicinity of 16,800-16,900 levels.
Below 16,800, Nifty could move down towards the next support of 16,604, which happens to be a 61.8 percent retracement of the entire upswing seen from 15,671 to 18,115 (April 4, 2022 high). In this current choppy trend, we expect many midcap/small-cap stocks to do well in the coming weeks.
Here are three buy calls for the next 3-4 weeks:
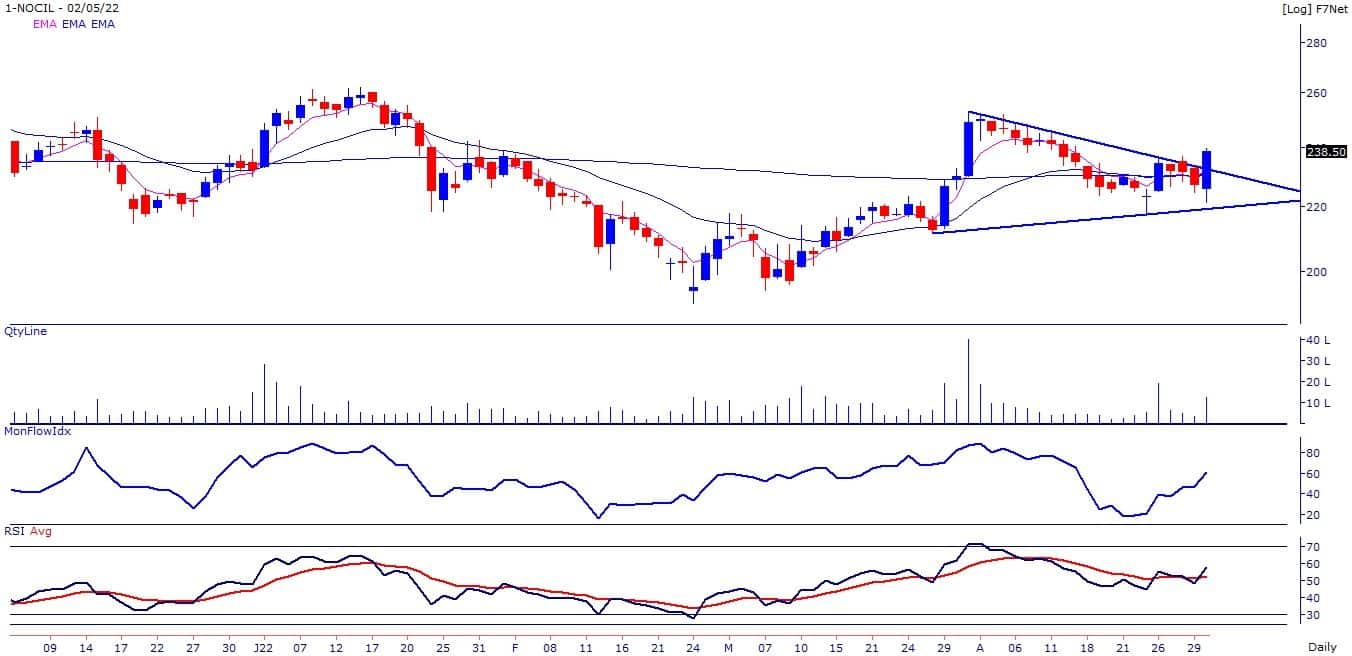
NOCIL: Buy | LTP: Rs 238.5 | Stop-Loss: Rs 225 | Target: Rs 265 | Return: 11 percent
The stock price has broken out from the symmetrical triangle on the daily chart. Primary trend of the stock turned positive as it has closed above its 200-day EMA.
RSI (relative strength index) and MFI (money flow index) oscillator is placed above 60 and sloping upwards, indicating strength in the current uptrend of the stock. The stock price has also broken out on the daily chart with a surge in volumes.
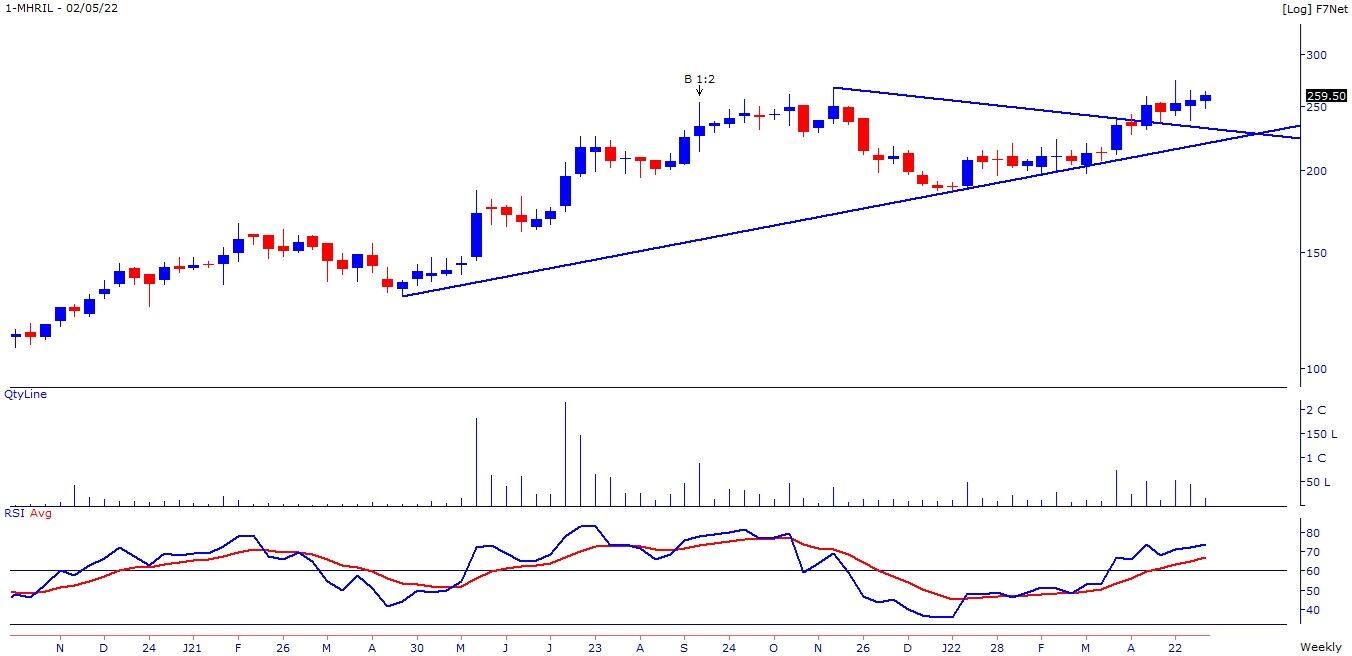
Mahindra Holidays and Resorts India: Buy | LTP: Rs 259.5 | Stop-Loss: Rs 240 | Target: Rs 300 | Return: 16 percent
The stock price has broken out from the symmetrical triangle on the weekly chart to close at highest level since August 2017. It is forming higher top higher bottom formation on the daily and weekly chart.
RSI Oscillator is placed above 60 and sloping upwards, indicating strength in the current uptrend of the stock.
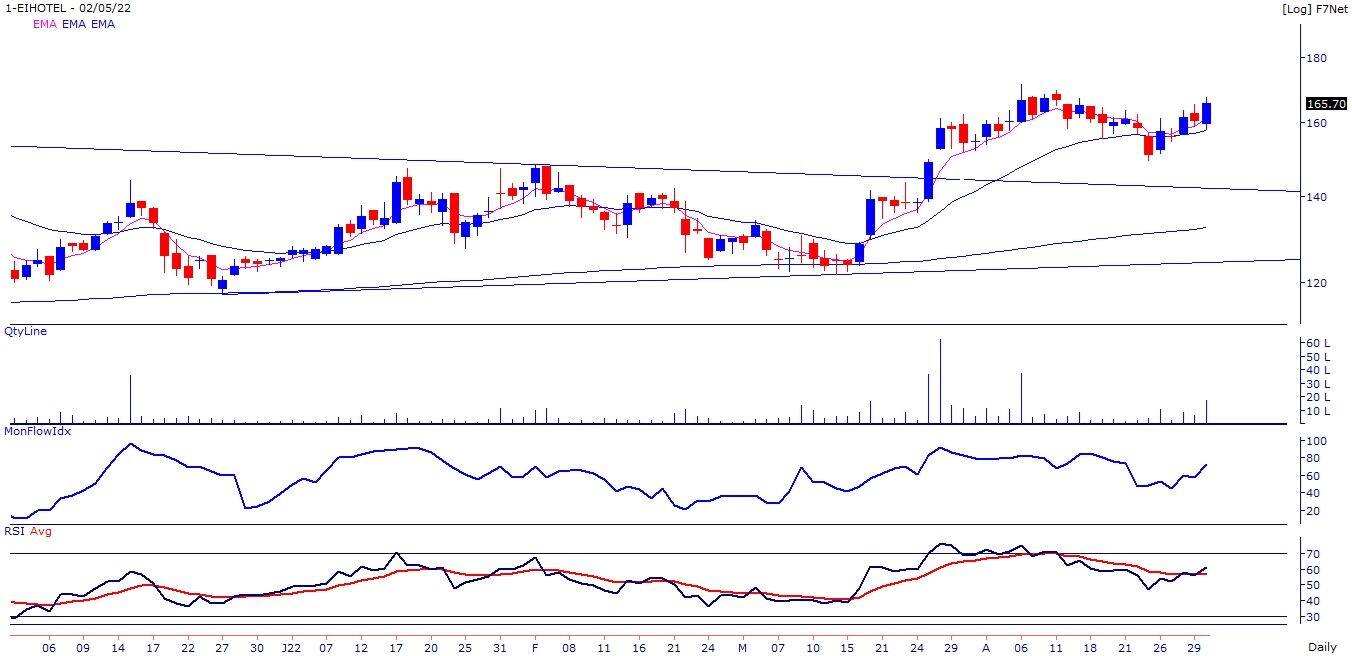
EIH: Buy | LTP: Rs 165.7 | Stop-Loss: Rs 155 | Target Rs 185 | Return: 12 percent
The stock price has broken out on the daily chart with higher volumes to close at highest level since April 11, 2022. It has already broken out from the symmetrical triangle on weekly chart.
Primary trend of the stock is positive as it is trading above its all important short term and long term moving averages. Momentum oscillators like RSI and MFI are placed above 60 and rising upwards, indicating strength in the current uptrend of the stock.
Disclaimer: The views and investment tips expressed by investment experts on Moneycontrol.com are their own and not those of the website or its management. Moneycontrol.com advises users to check with certified experts before taking any investment decisions.

Discover the latest business news, Sensex, and Nifty updates. Obtain Personal Finance insights, tax queries, and expert opinions on Moneycontrol or download the Moneycontrol App to stay updated!