On the monthly chart, the Nifty50 has continued to sustain above previous month's high which indicates bullish undertone in the index.
Nifty on the weekly timeframe is forming higher high, higher bottom pattern since past 9 weeks and has sustained above 50-week SMA (simple moving average) which shows bullish sentiment.
On the daily timeframe, we have witnessed a steep rise in the index which tells that the bulls have strong grip over the market. Relative strength index (RSI) plotted on the daily time frame is rising as the prices are rising which reflects that the prices have strong momentum.
Going ahead, the resistance for the Nifty is placed at the level of 18,115 (swing high) followed by the key resistance at 18,350. On the other side, index has its immediate support at the level of 17,720, followed by 17,350.
As per the short term chart pattern, we feel the index may attempt to reach its immediate resistance of 18,115 followed by 18,350. Our bullish view shall be negated if we see prices sustaining below 17,720 level.
Here are three buy calls for next 2-3 weeks:
Jubilant Foodworks: Buy | LTP: Rs 620.15 | Stop-Loss: Rs 550 | Target: Rs 790 | Return: 27 percent
The weekly chart of Jubilant Foodworks shows that the stock formed a small base around the 61.8 percent Fibonacci level of the prior swing from Rs 227.65 (March 2020) till Rs 920 (October 2021).
On the daily chart, the stock witnessed a breakout from the Inverse Head and Shoulder pattern, which is a bullish pattern. Here it indicates the beginning of trend on the upside.
The breakout is followed by high volumes which confirms the breakout.
Bollinger band plotted on the daily timeframe has started to expand, which tells that the volatility in the prices is rising for the upside movement.
The stock's RSI quoted above 50 mark on daily as well as on weekly timeframe, which reflects the bullish momentum in the prices. Going ahead we expect the prices to go higher till the level of Rs 790 where the stop-loss must be of Rs 550, on the closing basis.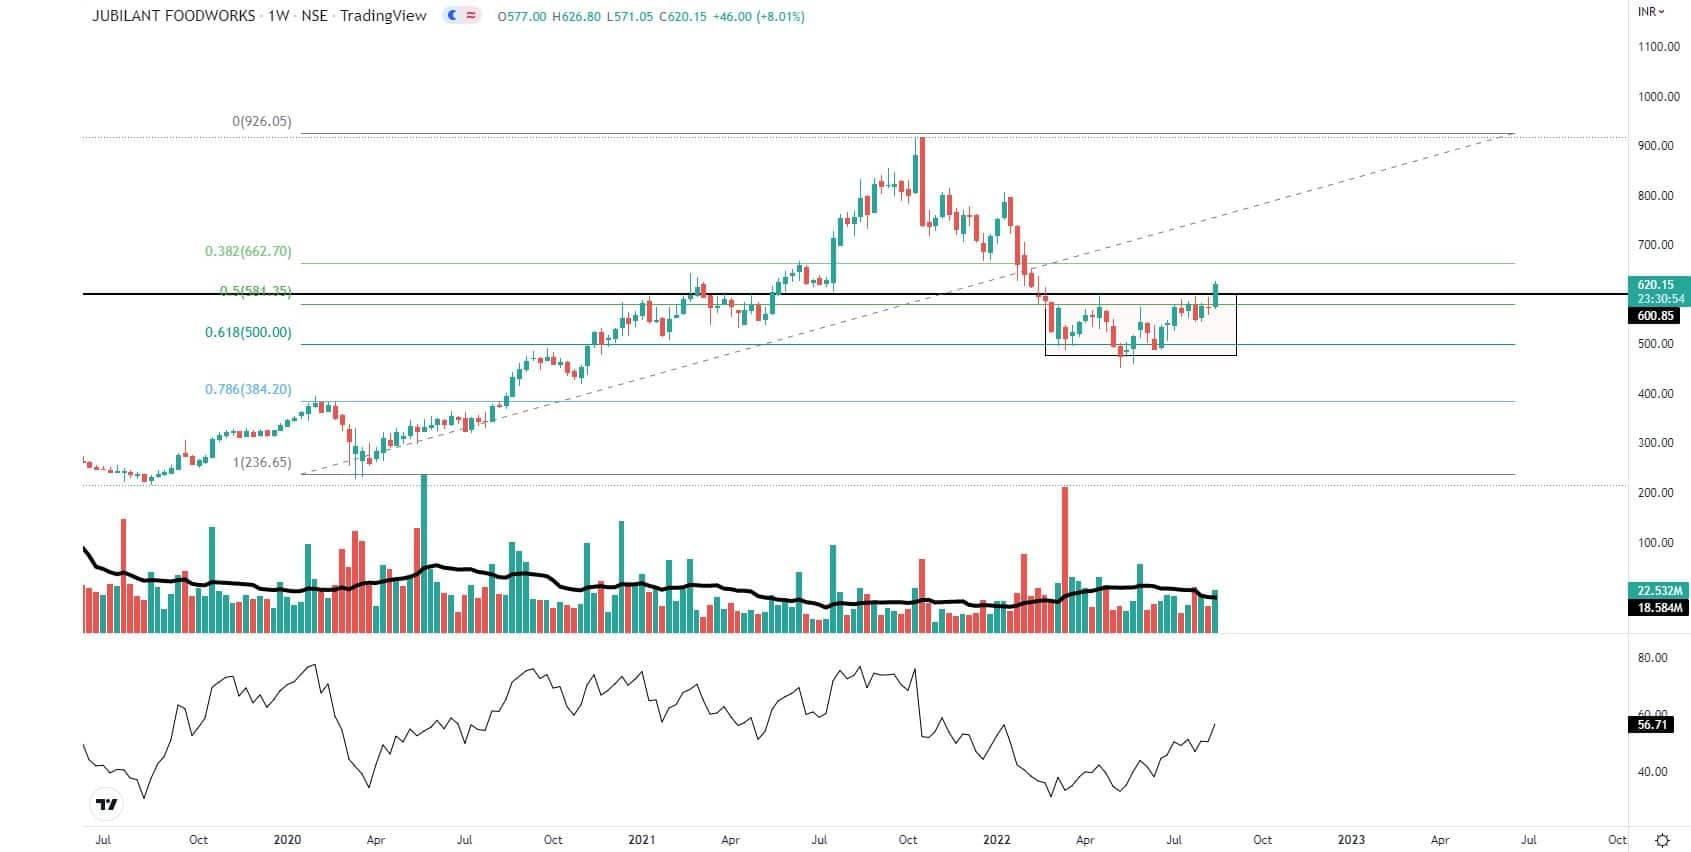
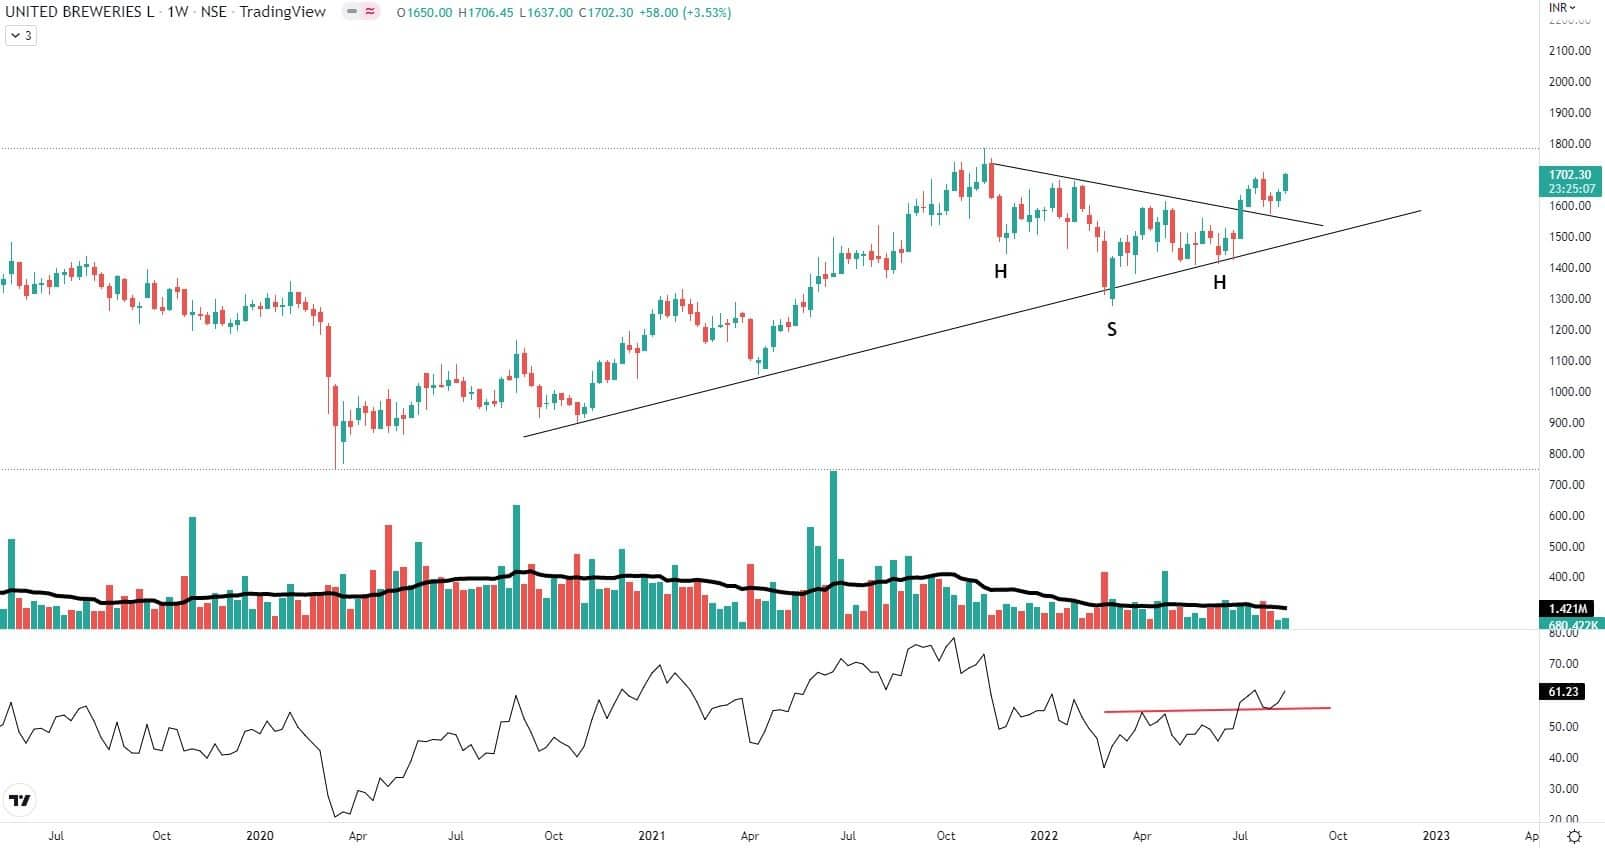
United Breweries: Buy | LTP: Rs 1,702.30 | Stop-Loss: Rs 1,523 | Target: Rs 2,000 | Return: 17 percent
On the weekly chart of UBL, we can observe that prices have shown a bounce on the upside since June 2022 while taking support from the bullish trend line which the prices are respecting since October 2020.
In the first week of July 2022 prices witnessed a breakout from Inverse Head & Shoulder pattern, which indicated a beginning of trend on the upside.
The breakout is followed by high volumes which confirms the breakout.
On the daily timeframe, we can witnessed that the prices have sustained above 50 days EMA (exponential moving average) which confirms that the prices are beginning the trend to the upside from prior downtrend.
RSI plotted on weekly timeframe have shown a range shift which points toward the increasing momentum in the prices.
Going ahead, we expect the prices to go higher till the level of Rs 2,000, where the stop-loss must be at the level of Rs 1,523 on the closing basis.
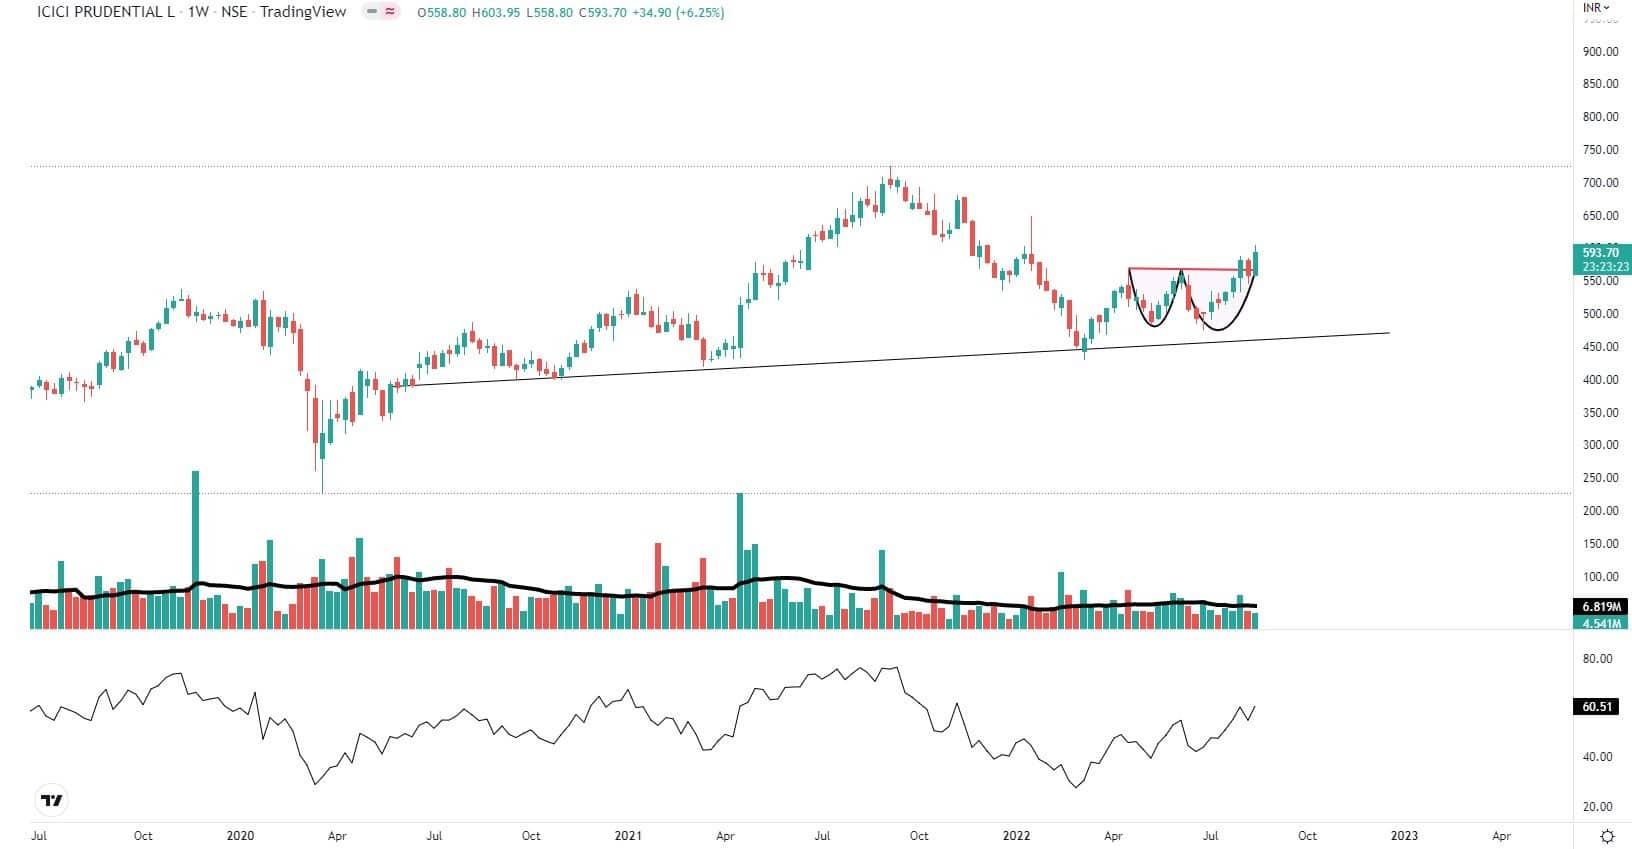
ICICI Prudential Life Insurance: Buy | LTP: Rs 593.70 | Stop-Loss: Rs 535 | Target: Rs 670 | Return: 13 percent
ICICI Prudential after a downtrend have made a base in the form of double bottom pattern around the level of Rs 475.
In the 1st week of August, we witnessed breakout from the double bottom pattern, which indicated a beginning of the trend on upside.
The breakout was followed by high volumes which confirms the breakout.
We can observe the Bollinger band is expanding on daily timeframe, which reflects that the volatility is rising for upside move.
RSI plotted on weekly timeframe have shown a range shift which points toward the increasing momentum in the prices.
Going ahead we expect the prices to go higher till the level of Rs 670 where one can place a stop-loss at the level of Rs 535 on the closing basis.
Disclaimer: The views and investment tips expressed by investment experts on Moneycontrol.com are their own and not those of the website or its management. Moneycontrol.com advises users to check with certified experts before taking any investment decisions.

Discover the latest business news, Sensex, and Nifty updates. Obtain Personal Finance insights, tax queries, and expert opinions on Moneycontrol or download the Moneycontrol App to stay updated!