Bears seemed to have returned to rule the investor sentiment when the market reversed the gains of the last two weeks and lost 1 percent by the close on October 20, forming a bearish candlestick pattern on the weekly charts.
But, since the index held on to the 19,500-19,480 zone, there's some hopes of a rebound towards 19,600-19,800. In case the index breaks down below the support at 19,480, the low of the previous week, the October low of 19,300 may be tested in the next sessions, experts said.
The Nifty50 settled the week ended October 20 at 19,543, down more than 200 points.
"The market conditions remain tentative till global uncertainty prevails and the same could be seen on the technical charts," Osho Krishan, senior analyst for technical and derivative research at Angel One, said.
As far as levels are concerned, he feels, the bullish gap of 19,490-19,450 withholds immediate support, followed by 19,400, while any breakdown could disrupt the ongoing view, and the recent swing low of 19,333 would become very much in the vicinity.
On the higher end, 19,700-19,750 is expected to act as an immediate hurdle, followed by the formidable resistance of 19,850-19,880 (bearish gap) and an authoritative breakthrough could only re-affirm the lost momentum to the bulls of D-Street, he said.
Jigar S Patel, senior manager of equity research at Anand Rathi, said that for the the current week, 19,500 might be an important support on a closing basis. "A convincing move below the same might bring the swing low of 19,333, which is also the low of Doji under threat. This can be a fresh trigger for further panic."
Osho advised avoiding aggressive overnight bets as an intense bout of profit-booking is evident in the midcap space as indicated by the negative crossover of the RSI-smoothened in the weekly time frame chart.
This condition is very rare as the negative development in this oscillator is visible in the extreme overbought territory, coupled with a breakdown in prices during Friday's session. The Nifty Midcap 100 index remained rangebound for the last five weeks.
Let's take a look at the top 10 trading ideas by experts for the next three-four weeks. Returns are based on the October 20 closing prices:
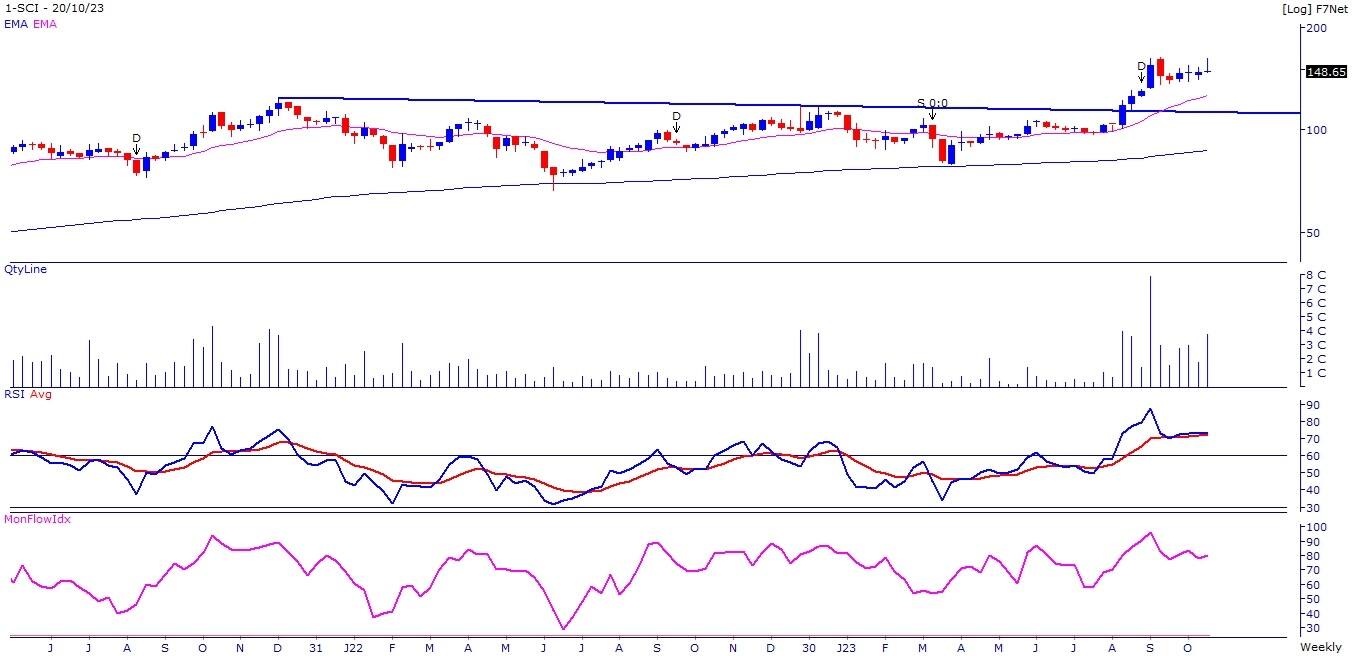
Shipping Corporation of India: Buy | LTP: Rs 148.7 | Stop-Loss: Rs 138 | Target: Rs 161-170 | Return: 14 percent
The stock price has broken out on the monthly chart by surpassing the resistance of Rs 125-odd levels. The primary trend of the stock is positive as the stock price is placed above its long term moving averages.
The stock price has corrected 9 percent from the recent high of Rs 162 odd levels which we believe is a buying opportunity for the near term. We expect stock to resume its uptrend in coming days.
Orient Cement: buy | LTP: Rs 202 | Stop-Loss: Rs 190 | Target: Rs 215-225 | Return: 11 percent
The stock price has broken out on the weekly line chart with higher volumes. Short term trend of the stock is positive as stock price is trading above its 11 and 20-day EMA (exponential moving average).
Momentum Indicators and oscillators like RSI (relative strength index) and MFI (money flow index) are sloping upwards and placed above 60 on the weekly chart, Indicating strength in the uptrend.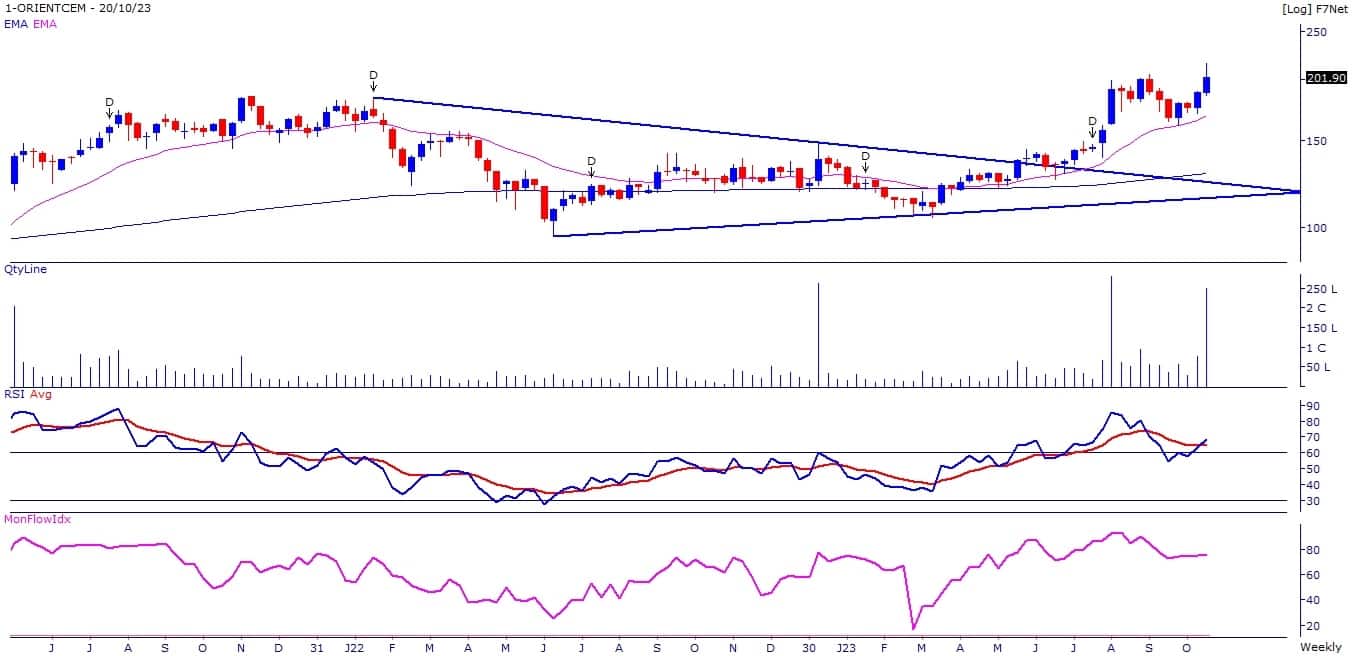
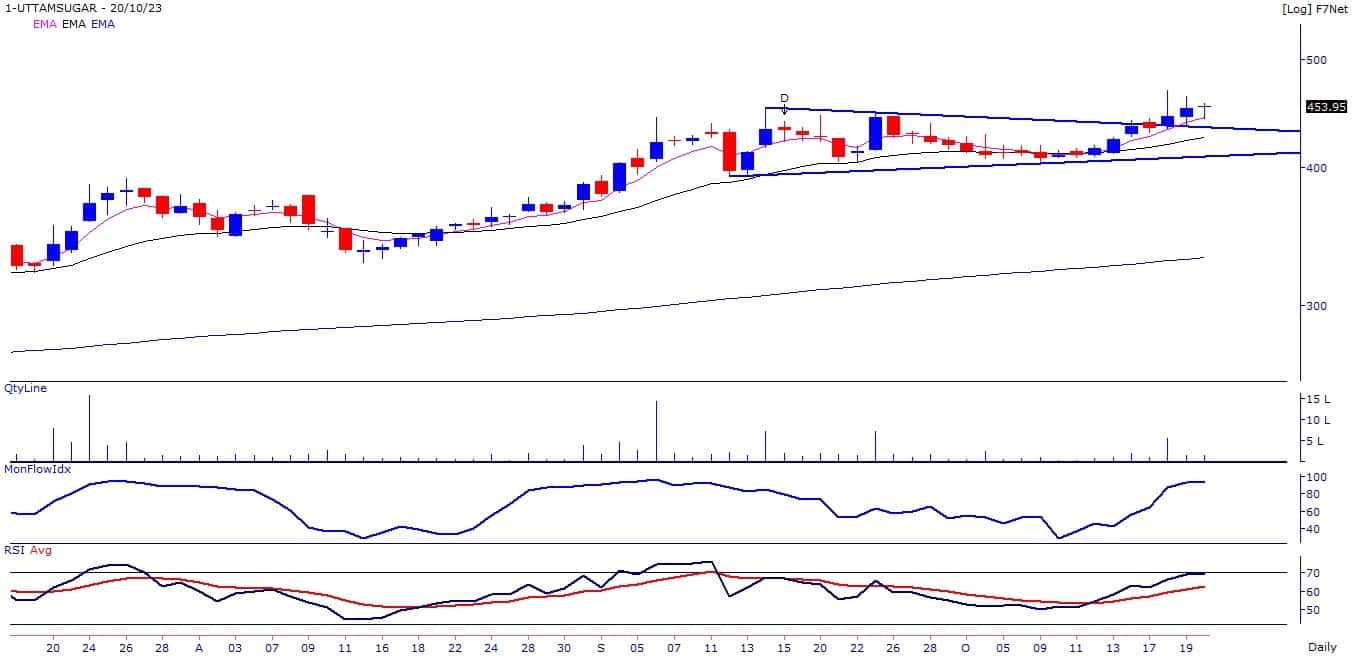
Uttam Sugar Mills: Buy | LTP: Rs 454 | Stop-Loss: Rs 420 | Target: Rs 490-510 | Return: 12 percent
The stock price has broken out on the daily line chart by surpassing the resistance of Rs 443 odd levels. Primary trend of the stock is positive as stock price is placed above its 50, 100 and 200-day moving averages.
Momentum indicators and oscillators like RSI and MFI are sloping upwards and placed above 60 on the weekly chart, Indicating strength in the uptrend.
Expert: Viraj Vyas, CMT, technical & derivatives analyst - institutional equity at Ashika Stock Broking
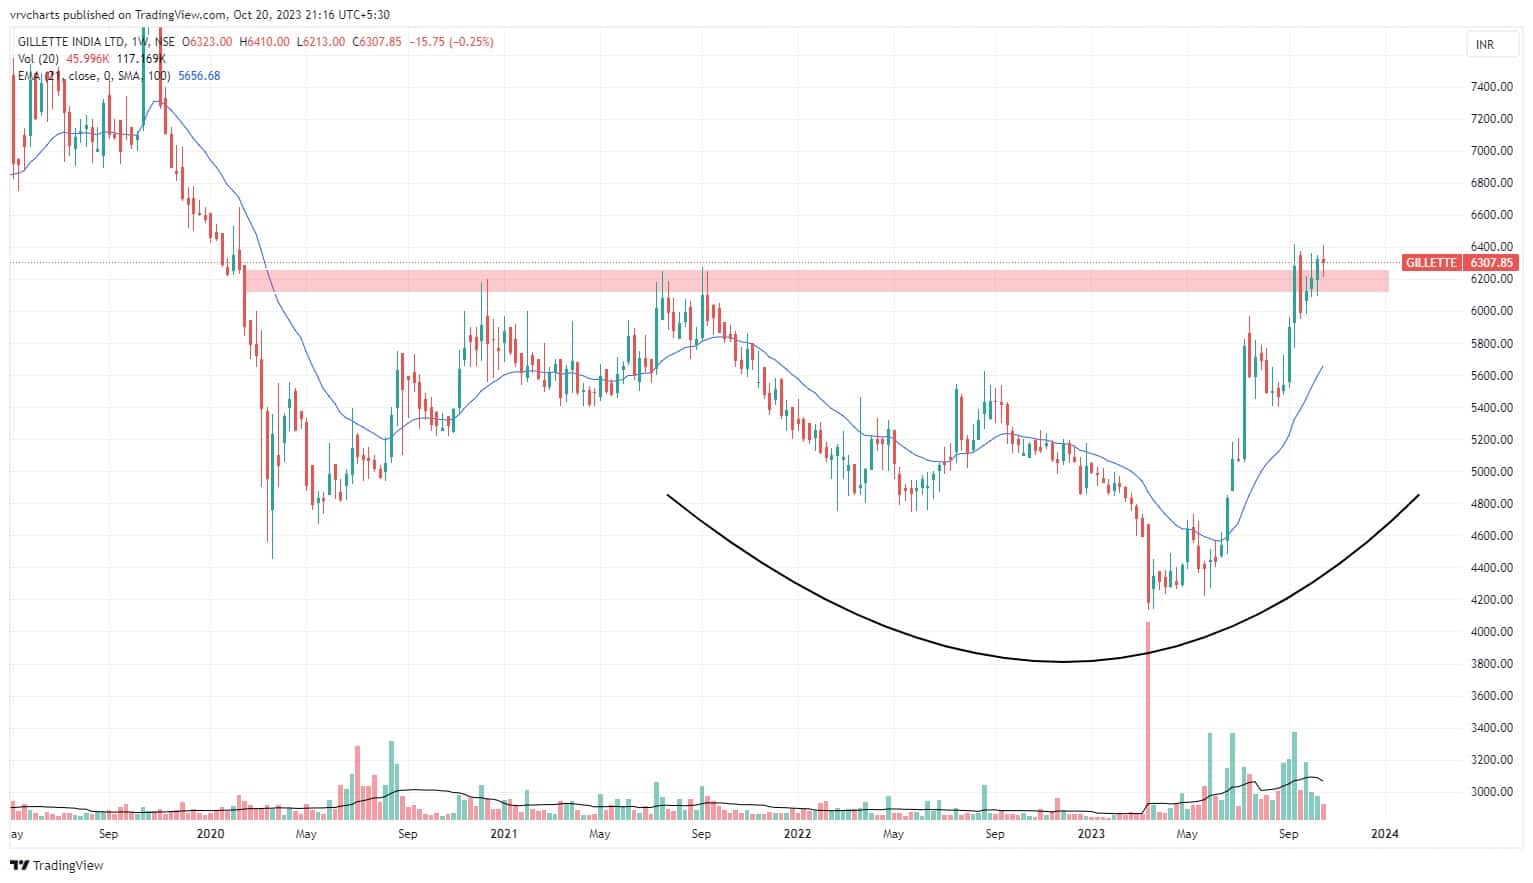
Gillette India: Buy | LTP: Rs 6,308 | Stop-Loss: Rs 6,000 | Target: Rs 7,050 | Return: 12 percent
The stock has been on a significant downtrend since November 2019, declining from Rs 8,200 to Rs 4,600. After reaching its low point, the stock experienced a period of time-based correction.
It is currently making an attempt to break above Rs 6,300-level. A successful breakout from this time-based correction pattern could have strong bullish implications, potentially propelling the stock towards Rs 7,000-7,100 zone.
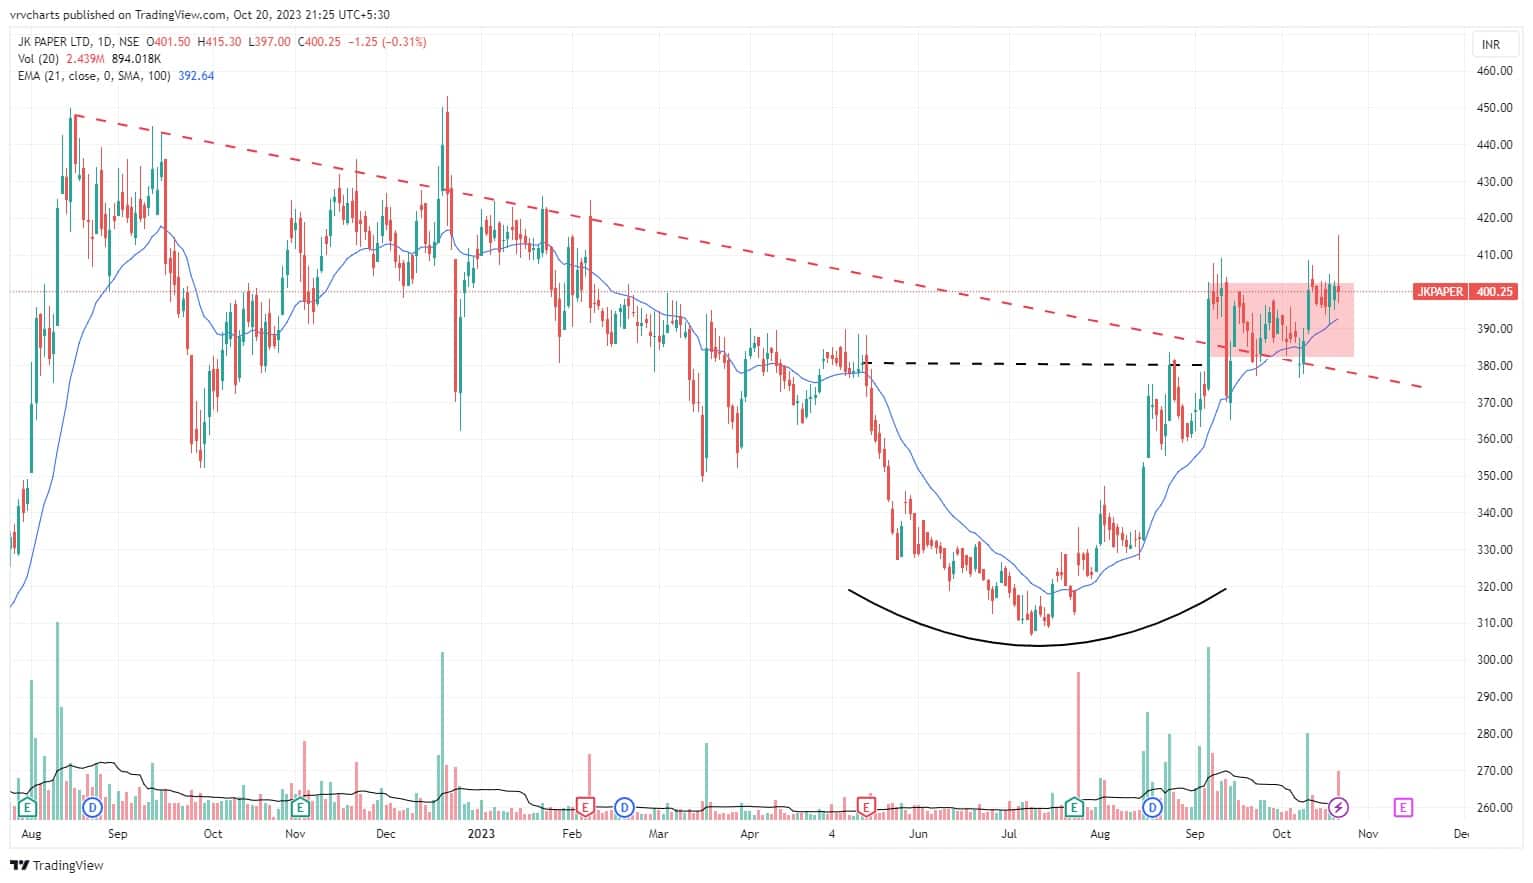
JK Paper: Buy | LTP: Rs 400 | Stop-Loss: Rs 380 | Target: Rs 450 | Return: 12.5 percent
The stock has endured a sharp downtrend since August 2022. However, between May and September 2023, it started forming a Rounding Bottom pattern. The breakout from this pattern was accompanied by a breakout of a key trendline.
Following this breakout, the stock entered a period of sideways consolidation. A strong price move above the Rs 405-406 range is anticipated to trigger a bullish impulse.
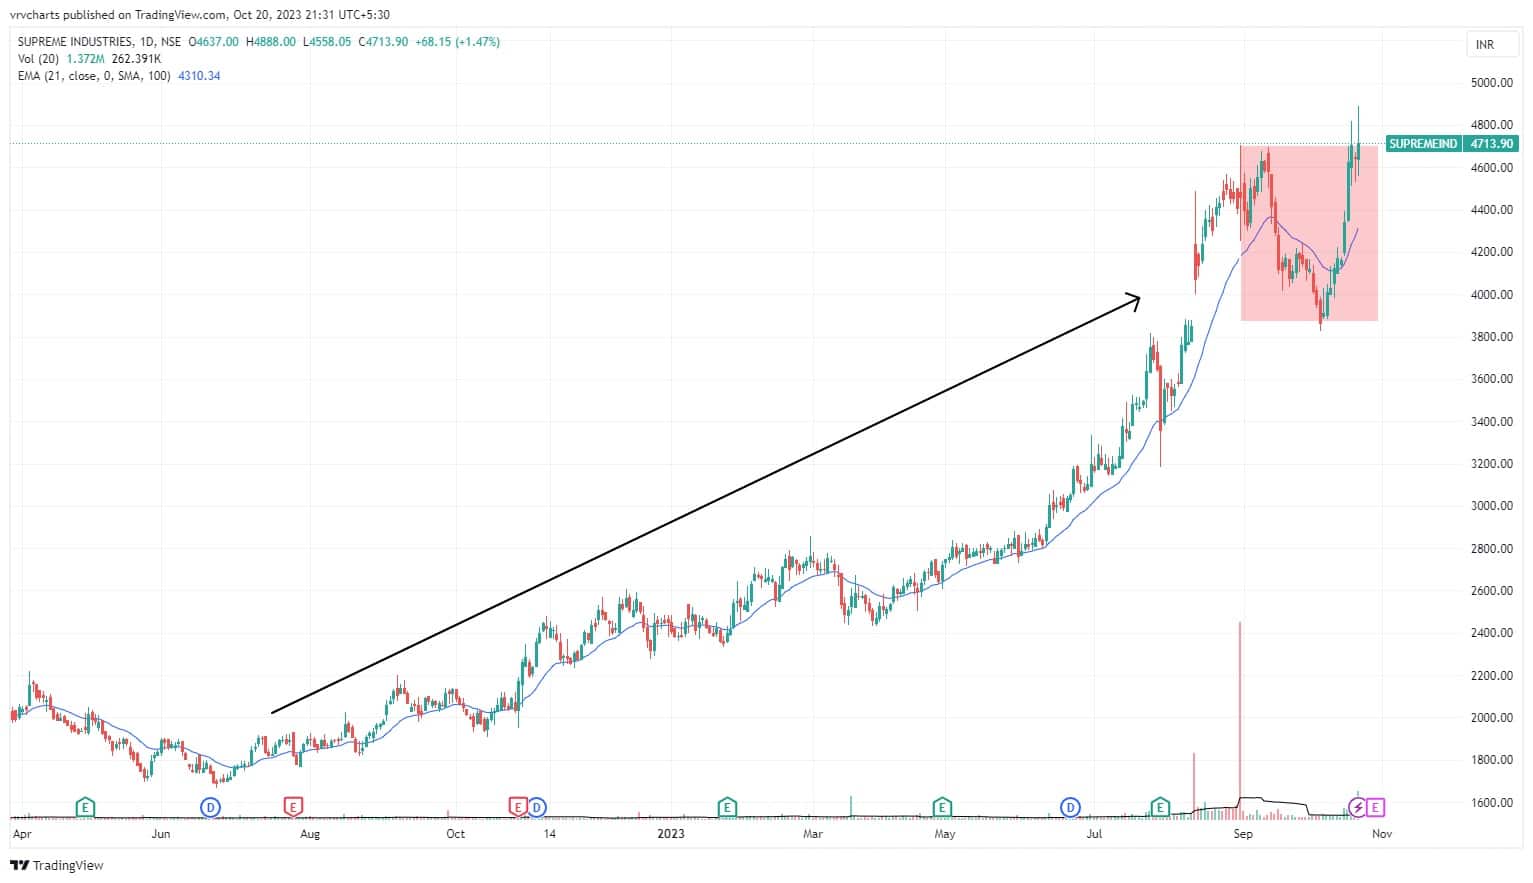
Supreme Industries: Buy | LTP: Rs 4,714 | Stop-Loss: Rs 4,475 | Target: Rs 5,275 | Return: 12 percent
The stock has been riding a robust uptrend and remains in a distinctly bullish phase. In September 2023, it briefly paused its upward trajectory. Notably, even during this correction, the stock swiftly rebounded, indicating a strong buying interest at lower levels.
Currently, the stock appears poised to surpass its previous all-time high, and it continues to exhibit relative strength compared to benchmark and broader indices.
Expert: Mitesh Karwa, research analyst at Bonanza Portfolio
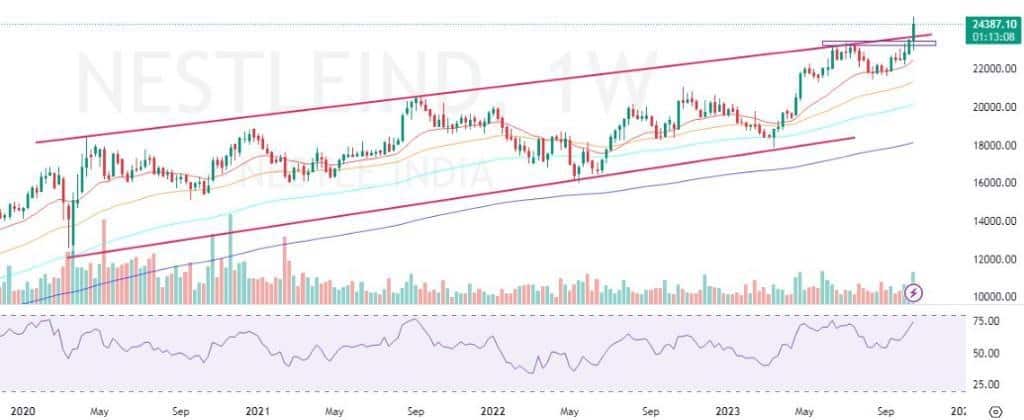
Nestle India: Buy | LTP: Rs 24,280 | Stop-Loss: Rs 23,700 | Target: Rs 25,346 | Return: 4 percent
Nestle India has seen breaking out of a upwards sloping parallel channel pattern on the weekly timeframe after almost three years with a bullish candlestick and above average volumes, adding to it the stock is trading and sustaining above all its important EMAs which can be used as a confluence towards the bullish view.
On the indicator front, the Ichimoku Cloud is also suggesting a bullish move as the price is trading above the conversion line, base line and cloud. Momentum oscillator RSI (14) is at around 70 on the daily time frame indicating strength by sustaining above 50.
Observation of the above factors indicates that a bullish move in Nestle is possible for target upto Rs 25,346. One can initiate a buy trade in between the range of Rs 24,200-24,279, with a stop-loss of Rs 23,700 on daily closing basis.
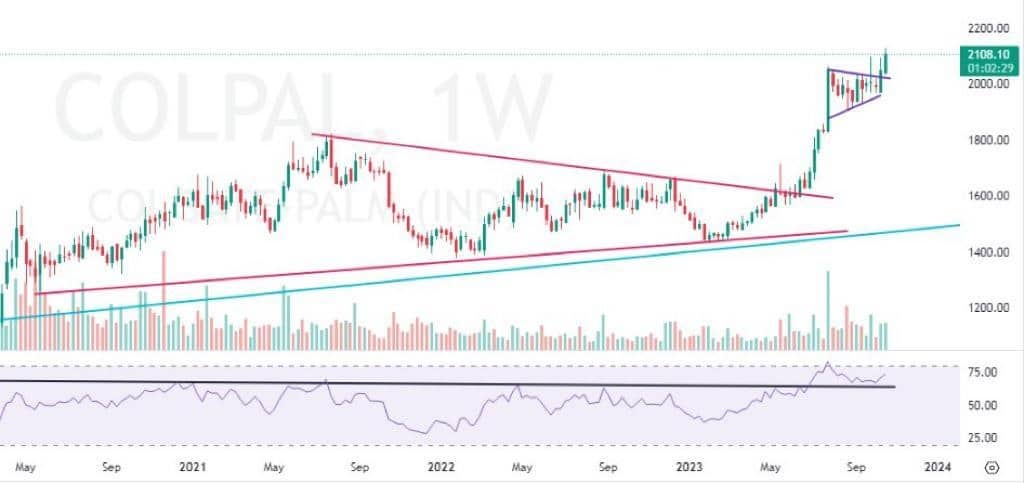
Colgate Palmolive: Buy | LTP: Rs 2,111 | Stop-Loss: Rs 2,034 | Target: Rs 2,234 | Return: 6 percent
Colgate Palmolive has seen breaking out of a Bullish Flag and Pole pattern on the weekly timeframe with above average volumes and formed a bullish candlestick on the weekly timeframe. In addition, the stock is trading above important EMAs of 20/50/100/200 on the daily timeframe which indicates strength.
On the indicator front, momentum oscillator RSI (14) is at around 65 on the daily time frame indicating strength by sustaining above 50. The Ichimoku Cloud is also suggesting a bullish move.
Observation of the above factors indicates that a bullish move in Colgate is possible for target upto Rs 2,234. One can initiate a buy trade in the range of Rs 2,090-2,100, with a stop-loss of Rs 2,034 on daily closing basis.
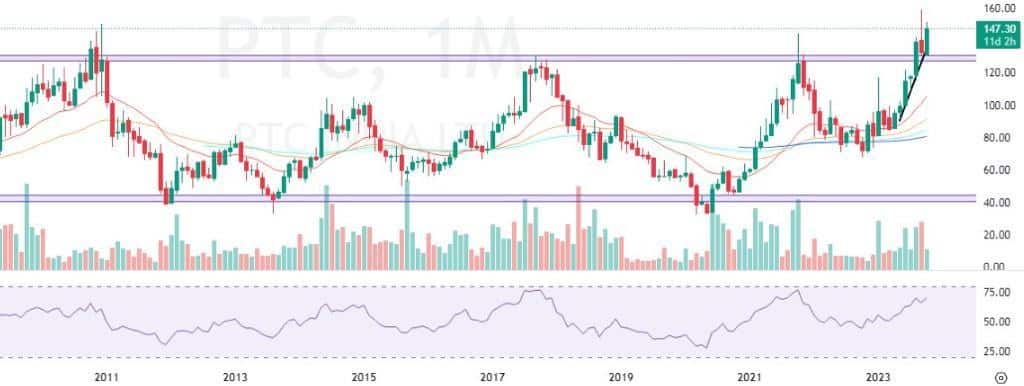
PTC India: Buy | LTP: Rs 147.65 | Stop-Loss: Rs 135 | Target: Rs 160 | Return: 8 percent
PTC India has seen breaking out of a resistance zone after almost twelve years on the monthly timeframe with a bullish candlestick and above average volume which indicates strength as the stock is also trading above all its important EMAs on the daily timeframe which acts as a confluence.
The Supertrend indicator is also indicating a bullish continuation which supports the bullish view. Momentum oscillator RSI (14) is at around 64 on the daily time frame indicating strength by sustaining above 50.
And the Ichimoku Cloud is also suggesting a bullish move as the price is trading above the conversion line, base line and cloud.
Observation of the above factors indicates that a bullish move in PTC is possible for target upto Rs 160. One can initiate a buy trade in between the range of Rs 145-147, with a stop-loss of Rs 135 on daily closing basis.
Expert: Jigar S Patel, senior manager - equity research at Anand Rathi
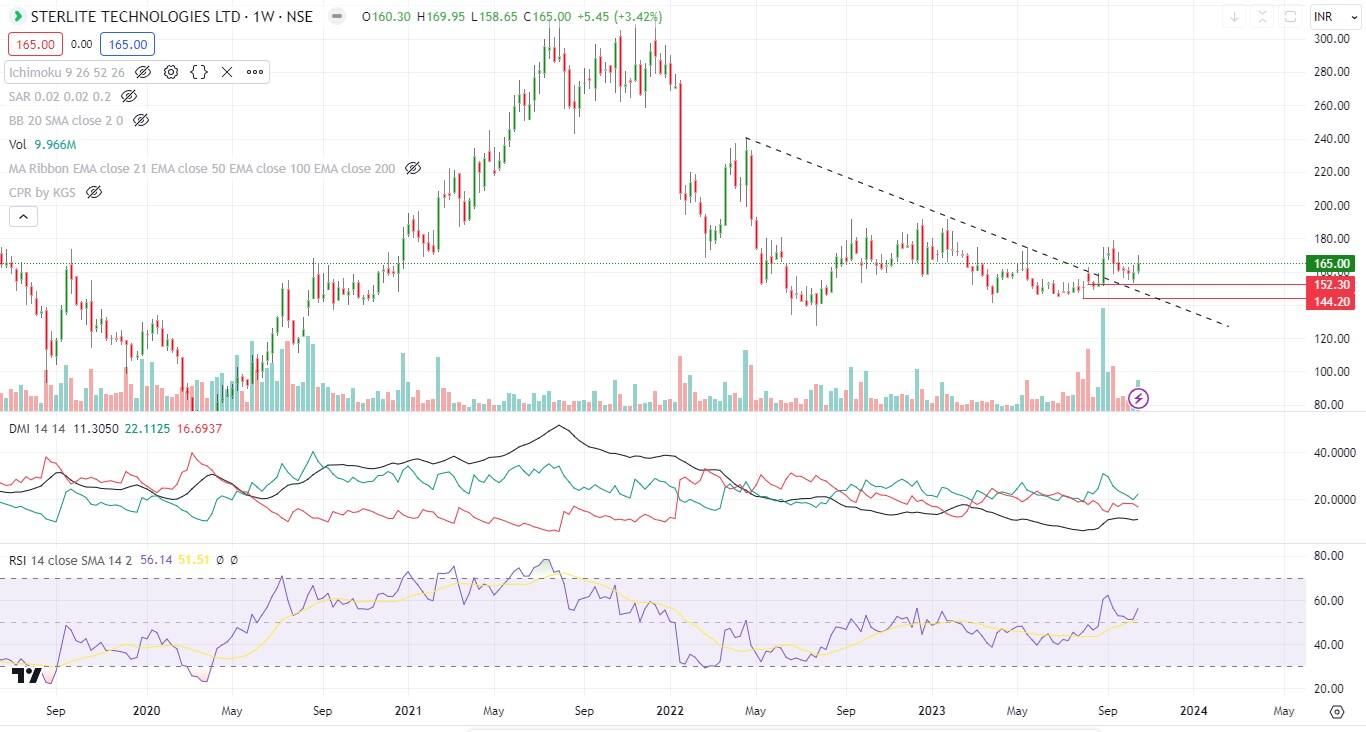
Sterlite Technologies: Buy | LTP: Rs 165 | Stop-Loss: Rs 145 | Target: Rs 200 | Return: 21 percent
Since the last 3 months, the said counter has been consolidating in the range of Rs 145-155. Recently it had given a clean breakout from the said range and is currently placed at Rs 171 levels. Having said that, it has also cleared its downward-sloping trendline quite comfortably. The best part about this reversal is it has bounced back from its monthly central pivot range which has acted as massive support.
One can buy in the zone of Rs 160-165 for a target of Rs 200 and the stop-loss would be around Rs 145 on a daily closing basis.
Disclaimer: The views and investment tips expressed by investment experts on Moneycontrol.com are their own and not those of the website or its management. Moneycontrol.com advises users to check with certified experts before taking any investment decisions.
Discover the latest Business News, Budget 2025 News, Sensex, and Nifty updates. Obtain Personal Finance insights, tax queries, and expert opinions on Moneycontrol or download the Moneycontrol App to stay updated!