


The southward journey in the benchmark indices continued for yet another session, but the market closed off the day's low due to a cut down in losses for support-based buying.
The Nifty50 fell near 17,750 but showed smart recovery in the last hour of trade and defended the 17,800 area. Finally, the index fell 38 points to close at 17,858, and formed bearish candle with long lower shadow which, to some extent, resembles a hammer kind of pattern formation, indicating potential bullish reversal in the market.
The BSE Sensex declined nearly 150 points to 59,958, while the Bank Nifty was down by 150 points to 42,082 and formed bearish candle on the daily charts with long lower shadow indicating support-based buying.
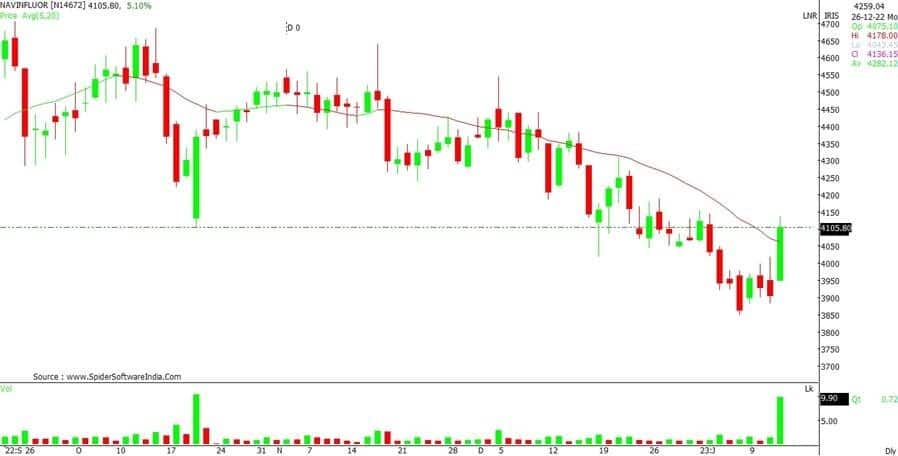
Stocks that were in action and performed better than broader markets included Navin Fluorine International which was the biggest gainer in the futures & options segment, rising 5.56 percent to Rs 4,123.65, the highest closing level since December 26, 2022 and formed robust bullish candle on the daily charts with significantly higher volumes. It has decisively broken consolidation range seen in last one week.
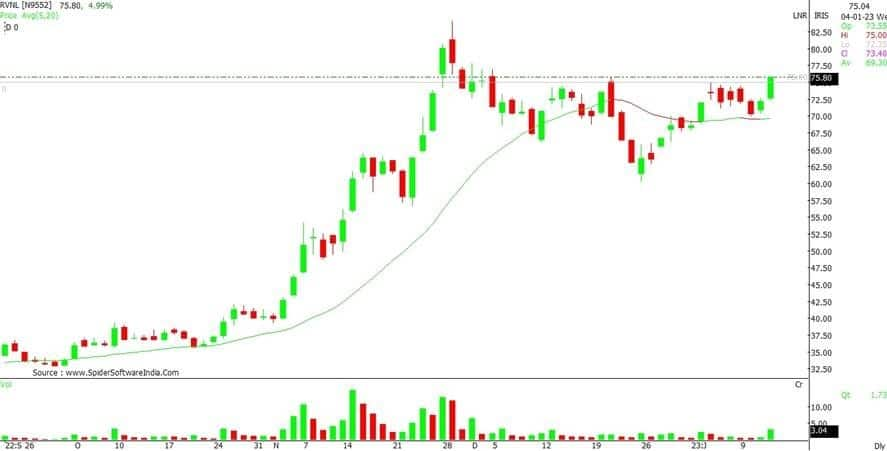
Rail Vikas Nigam shares were locked in 5 percent upper circuit at Rs 75.80 and formed long bullish candle on the daily charts with above average volumes, making higher high higher low for second consecutive session. The stock has seen a breakout of horizontal resistance trend line adjoining multiple touchpoints - December 14, 2022, January 6 and January 9, 2023, and also there was a breakout of downward sloping resistance trend line adjoining November 29, 2022 and January 9, 2023, indicating positive bias.
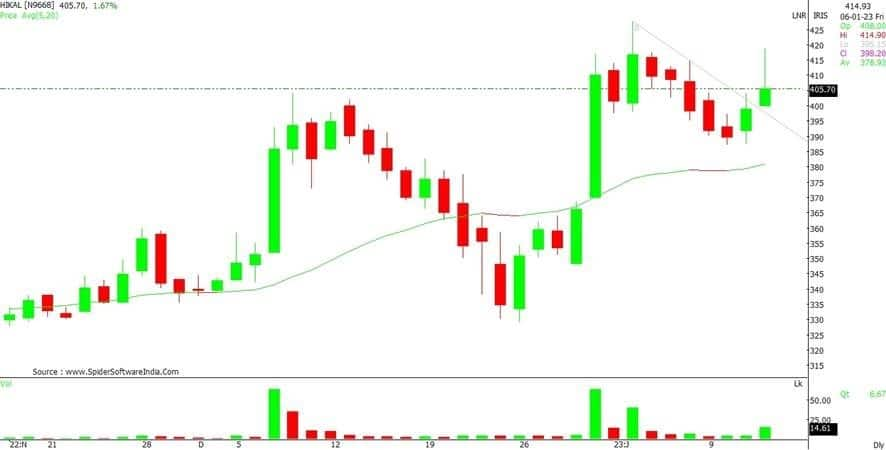
Hikal was also in focus, climbing 1.7 percent to Rs 405.75 and formed bullish candle with long upper shadow, indicating sign of bearishness. The stock has seen a breakout of downward sloping resistance trend line adjoining January 3, January 6 and January 11, 2023. Also there was a breakout of horizontal resistance trend line adjoining December 8, 2022 and January 11, 2023.
Here's what Shrikant Chouhan of Kotak Securities recommends investors should do with these stocks when the market resumes trading today:
After a long correction the stock took the support near Rs 3,850 and reversed sharply. On last Thursday the stock rallied over 5 percent. Despite tepid market conditions, the stock held the positive momentum throughout the day.
Technically, the medium term texture of the stock is still in to the bearish side. However, above Rs 4,000 the pullback formation is likely to continue.
We are of the view that, above Rs 4,000 the pullback rally will continue till 20-day SMA (simple moving average) or Rs 4,200-4,250. On the flip side, fresh round of selling is possible only after dismissal of Rs 4,000. Below the same, the stock could retest Rs 3,900-3,850 levels.
After a short term correction, the stock has consistently been forming higher low formation. On last Thursday, the stock has rallied 5 percent and also formed long bullish candle which is broadly positive.
For trend following traders now, 20-day SMA or Rs 70 would act as a sacrosanct support zone. Above which, it could move up till Rs 80 -82. On the flip side, below Rs 70 traders may prefer to exit from the trading long positions.
After a sharp uptrend rally from Rs 335 to Rs 425, currently the stock is hovering between Rs 390 to Rs 420 price range. However, the medium term formation is still in to the positive side.
We are of the view that the short term texture of the chart is non-directional and fresh uptrend rally is possible only after Rs 425 breakout. Above the same, it could rally till Rs 450-460.
On the flip side, below Rs 395 the selling pressure is likely to accelerate. Below the same it could retest 20-day SMA (simple moving average) or Rs 380. Further downside may also continue which could drag the stock till 50-day SMA or Rs 370.
Disclaimer: The views and investment tips expressed by investment experts on Moneycontrol.com are their own and not those of the website or its management. Moneycontrol.com advises users to check with certified experts before taking any investment decisions.
Discover the latest business news, Sensex, and Nifty updates. Obtain Personal Finance insights, tax queries, and expert opinions on Moneycontrol or download the Moneycontrol App to stay updated!


